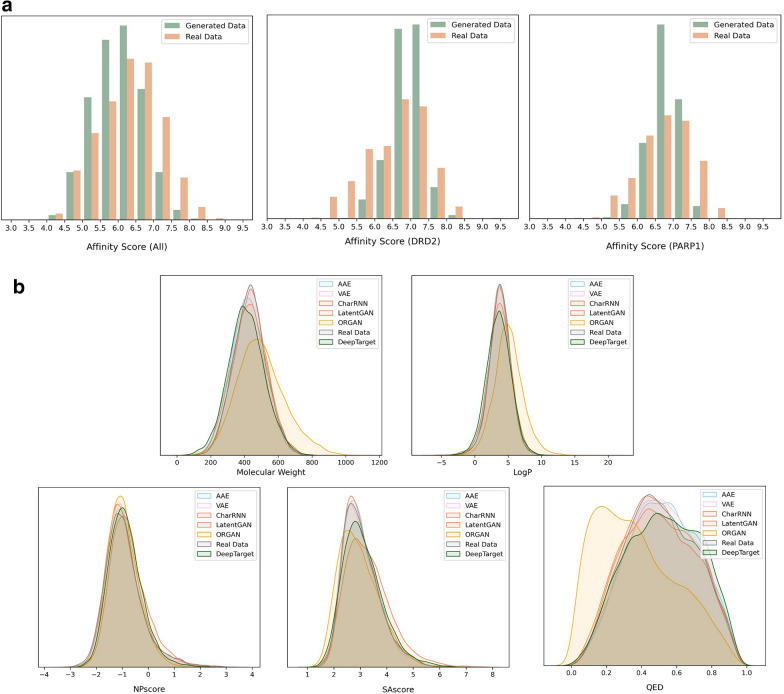
Fig. 4.
a Drug-Protein affinity distributions for randomly selected drug-protein pairs in the generated molecules and for drug-protein pairs in the original dataset (the left). Drug-Protein affinity of generating molecules and known active molecules of DRD2 and Parp1 (the two on the right). b Distributions of property values for the generated compounds. Properties include, Lipophilicity (LogP), Molecular Weight (MW), Natural Products-likeness (NP-likeness), synthetic accessibility Score (SAscore) and Quantitative Estimation of Drug-likeness (QED)

