FIG. 2.
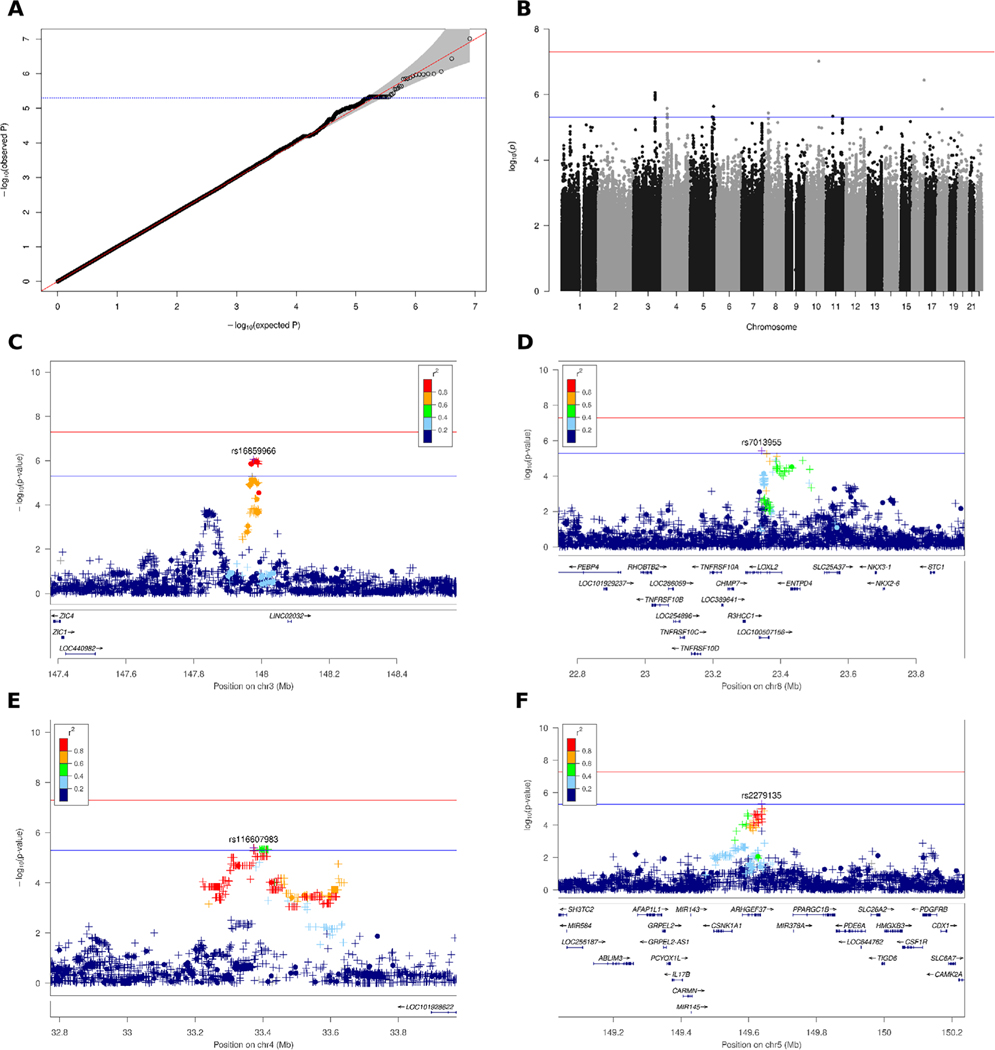
Association plots for multiple system atrophy (MSA). (A) QQ (quantile-quantile) plot based on 8,109,760 variants after imputation. (B) Manhattan plot showing –log10 P values from logistic regression on imputed variants with sex and two principal components as covariates plotted against their chromosomal position. The red and blue lines indicate the genome-wide significance threshold of 5 × 10⁻⁸ and threshold for suggestive associations of 5 × 10⁻⁶, respectively. (C) Regional plot for the association between MSA and variants on chromosome 3 in the genomic region from 147.4 to 148.6 Mb. A circle represents a genotyped variant and a plus symbol an imputed variant. The r2 metric displays the pairwise linkage-disequilibrium (LD) between the leading and the respective variant. The bottom part shows gene positions. (D) Regional plot for associations on chromosome 8 in the genomic region from 22.7 to 23.9 Mb. (E) Regional plot for associations on chromosome 4 in the genomic region from 32.8 to 34.0 Mb. (F) Regional plot for associations on chromosome 5 in the genomic region from 149.0 to 150.2 Mb. [Color figure can be viewed at wileyonlinelibrary.com]

