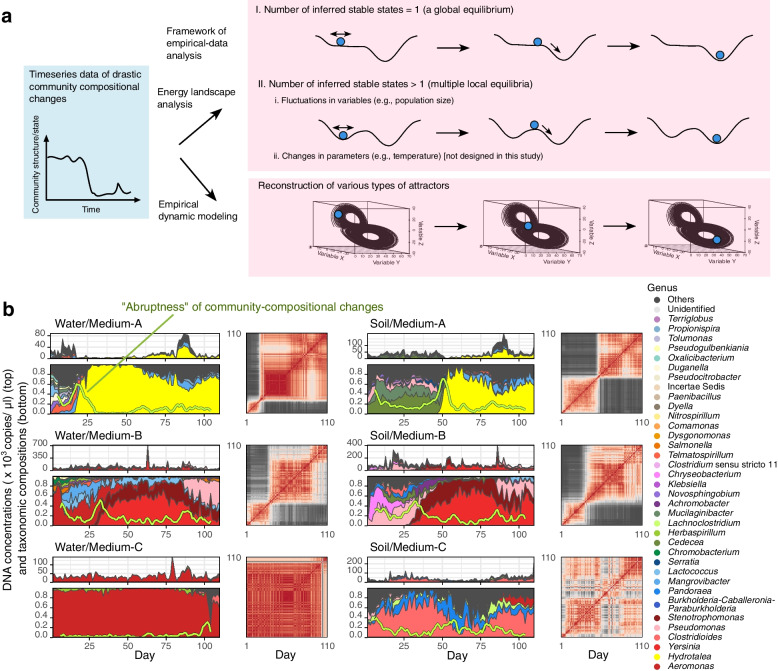
Fig. 1.
Experimental microbiome dynamics. a Assumptions. Drastic structural changes in microbiome time-series data are interpreted as transient dynamics towards a global equilibrium, shifts between local equilibria (alternative stable states), or dynamics around complex forms of attractors. The former two concepts/models can be examined with an energy landscape analysis and the latter can be explored based on empirical dynamic modeling. b Time-series data of microbial abundance (top left), community compositions (relative abundance; bottom left), and Bray-Curtis dissimilarity (β-diversity) of community structure between time points (right) are shown for a representative replicate community of each experimental treatment. The green lines within the relative abundance plots represent the speed and magnitude of community compositional changes (hereafter, “abruptness”) around each target time point (time window = 5 days; time lag = 1 day; see “Methods” section). Note that an abruptness score larger than 0.5 represents turnover of more than 50% of microbial ASV compositions. See Additional files 3 and 4: Figure S3–4 for the time-series data of all the 48 communities (8 replicates × 6 treatments)

