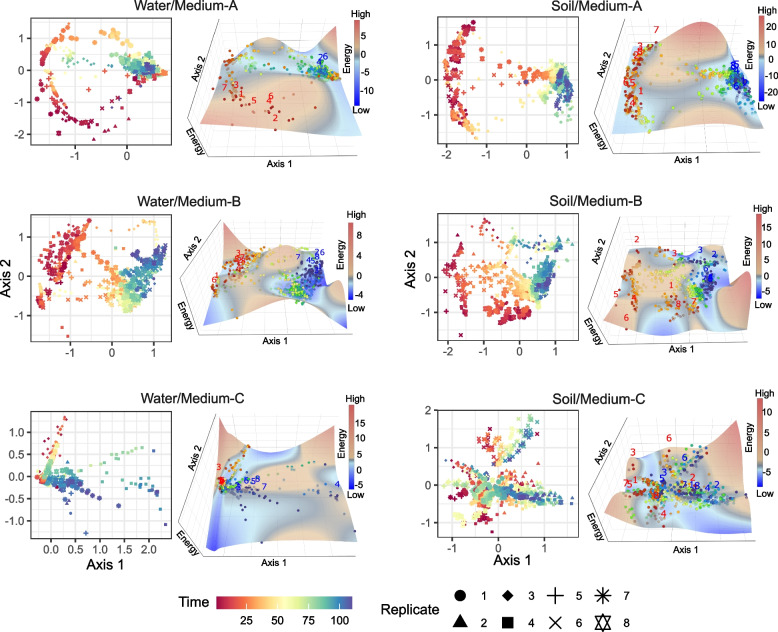
Fig. 2.
Energy landscapes of community structure. The community structure of respective time points on NMDS axes (left) and reconstructed energy landscape on the NMDS surface (right) are shown for each experimental treatment. Community states (ASV compositions) located at lower-energy regions are considered to be more stable on the energy landscapes. The shapes of the landscapes were inferred based on a smoothing spline method with optimized penalty parameters. On the energy landscapes, community states of day 1 and day 110 are respectively shown in red and blue numbers representing replicate communities

