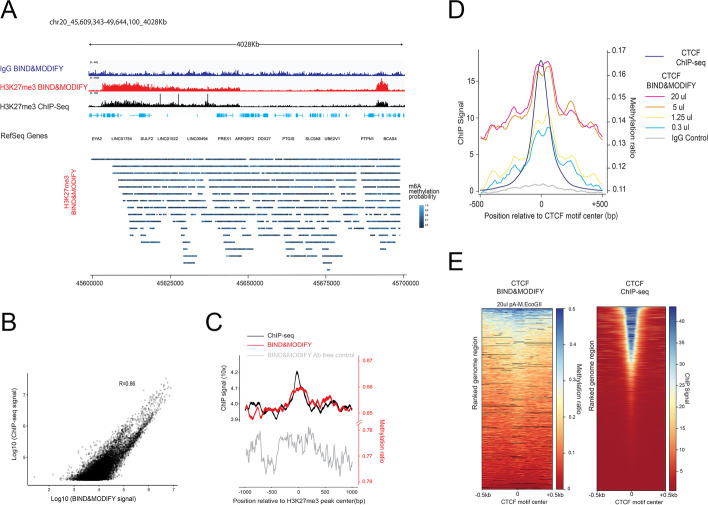
Fig. 2.
The consistency of H3K27me3 pattern between ChIP-seq and BIND&MODIFY in situ. A The nanopore data were aligned to the reference genome (mouse: MM10, human: HG19), and the methylation sites were called by our house pipeline based on the m6A methylation probability cut-off 0.53. Top panel: The H3K27me3 signal (BIND&MODIFY signal on the y-axis: the number of called m6A methylation sites in 100 bp bin; ChIP-seq signal on the y-axis: the read counts in 100 bp bin), by BIND&MODIFY with H3K27me3 /IgG antibody and ChIP-seq in genome scale view. Bottom panel: single-molecule reads with m6A probability. Each point on reads represented the adenosine and the color indicated the methylation probability. B The scatter plot of BIND&MODIFY signal (m6A counts) and ChIP-seq signal (read counts) in peak regions (the signal was normalized based on region length). C The H3K27me3 peak regions were called by MACS in ChIP-seq. Then the middles of all peak regions were centered at 0. The upstream/downstream 1000bps were plotted around the peak center 0 with sliding 100-bp bins. BIND&MODIFY y-axis indicated the mean methylation ratio in 100-bp bins, and ChIP-seq signal indicated the mean read counts. The antibody free control with untethered pA-M.EcoGII marked the chromatin accessibility. The signal of IgG control was low (not shown). D The effect of pA-M.EcoGII doses on CTCF patterns of BIND& MODIFY. Four doses of pA-M.EcoGII, (0.3, 1.25, 5, and 20 µl) were applied on 4T1 cell lines followed by BIND&MODIFY method, and mean m6A methylation ratio was plotted by + 500 bp/ − 500 bp of CTCF motif center (similar to panel C). The signal of IgG control was the lowest. E The genome region ranking of m6A methylation ratio and ChIP signal for CTCF motif center on each genome region of panel D. Mean m6A methylation ratios and ChIP signal (sliding 100-bp bins) were plotted around + 500 bp/ − 500 bp of CTCF motif center for each gene of 20 µl dose of pA-M.EcoGII and ChIP-seq. Color bar indicated mean methylation ratio. Each row indicated one genome region with CTCF motif center of one certain gene

