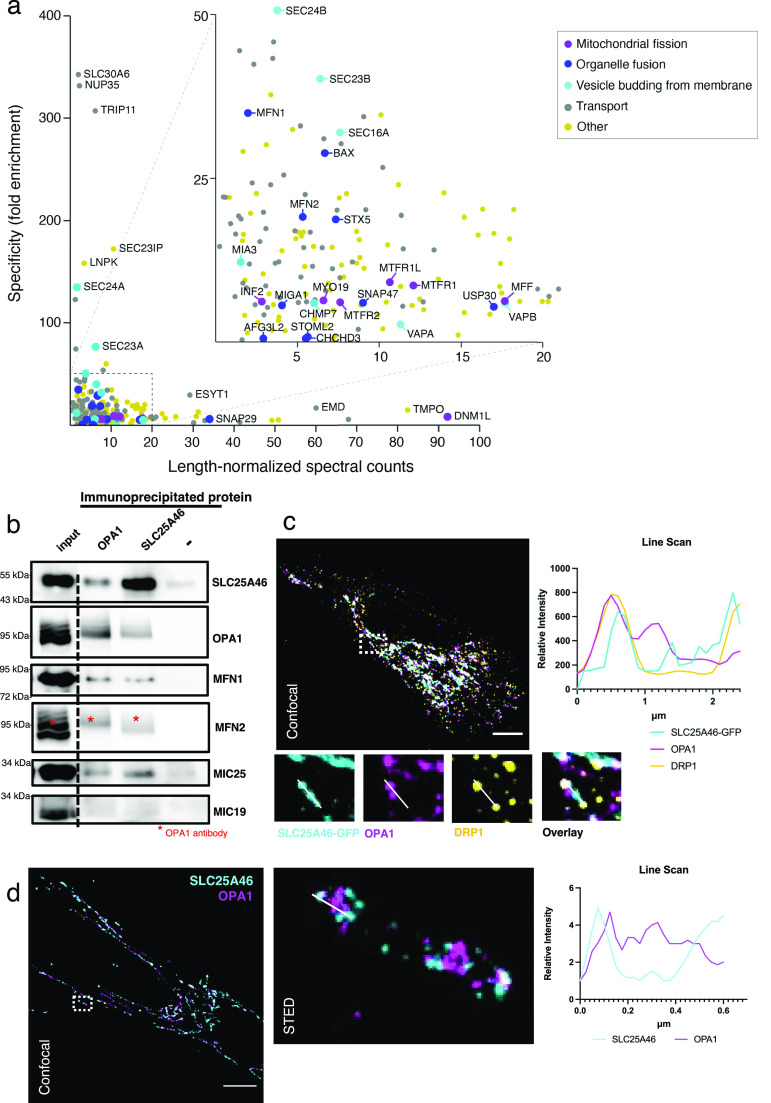
Figure 4. Association of SLC25A46 with the proteins of the fusion and fission machinery.
(A) Specificity plot of SLC25A46 (N-terminally BirA*-tagged) indicating the specificity (defined as fold enrichment) of interaction between preys identified as proximity interactors of SLC25A46 compared with their interaction with all the other baits in the dataset (Antonicka et al, 2020). GO term analysis was performed using g:Profiler, and proteins belonging to the indicated GO:BP terms are highlighted. (B) Endogenous SLC25A46 and OPA1 were immunoprecipitated from human fibroblast crude mitochondria, and co-immunoprecipitated proteins were separated on SDS–PAGE. Western blot analysis with indicated antibodies was performed. (C) Confocal microscopy analysis of fibroblasts expressing GFP-tagged SLC25A46. SLC25A46 is shown in cyan, OPA1 in magenta, and DRP1 in yellow. A line scan of the specified line in the image indicates the intensity of the signal of SLC25A46 in cyan, of OPA1 in magenta, and of DRP1 in yellow. Scale bar: 10 μm. (D) Stimulated emission depletion microscopy analysis of human fibroblasts. Endogenous SLC25A46 (in cyan) and OPA1 (in magenta) were detected by confocal (left) microscopy and stimulated emission depletion (right, a zoom of the boxed region in the confocal image). Scale bar: 10 μm. A line scan of the specified line in the image indicates the intensity of the signal of SLC25A46 in cyan and of OPA1 in magenta.

