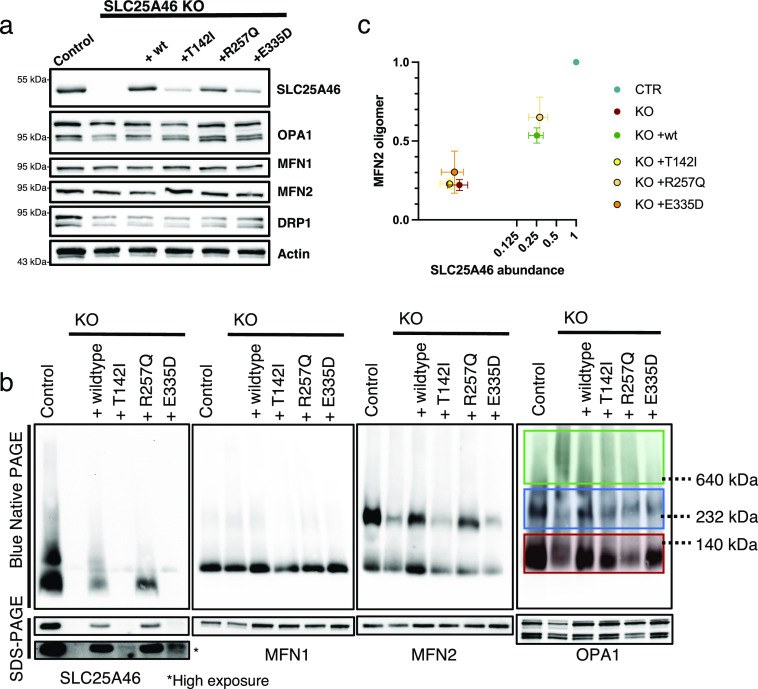
Figure 5. MFN2 high molecular weight oligomeric complexes are decreased in SLC25A46 loss-of-function cells.
(A) SDS–PAGE analysis of steady-state levels of fusion and fission machinery proteins in control fibroblasts, SLC25A46 knock-out fibroblasts, and knock-out fibroblasts overexpressing the WT SLC25A46 or pathogenic variants (T142I, R257Q, and E335D). Actin serves as a loading control. (B) BN-PAGE and SDS–PAGE analysis of 1% digitonin extracts from crude mitochondria prepared from indicated cell lines. Membranes were immunoblotted for the indicated proteins. OPA1 complexes are highlighted: green boxes indicate the high molecular weight complexes (>600 kD), blue boxes indicate the molecular weight complexes of 200–400 kD, and red boxes indicate the monomeric OPA1 forms. (C) Quantification of the MFN2 higher molecular weight complex in BN-PAGE (normalized to control) presented as a ratio to SLC25A46 (normalized to control). SLC25A46 levels are presented in log2 to visualize the lower values.n = 3 independent experiments; data are shown as the mean + SEM.
Source data are available for this figure.

