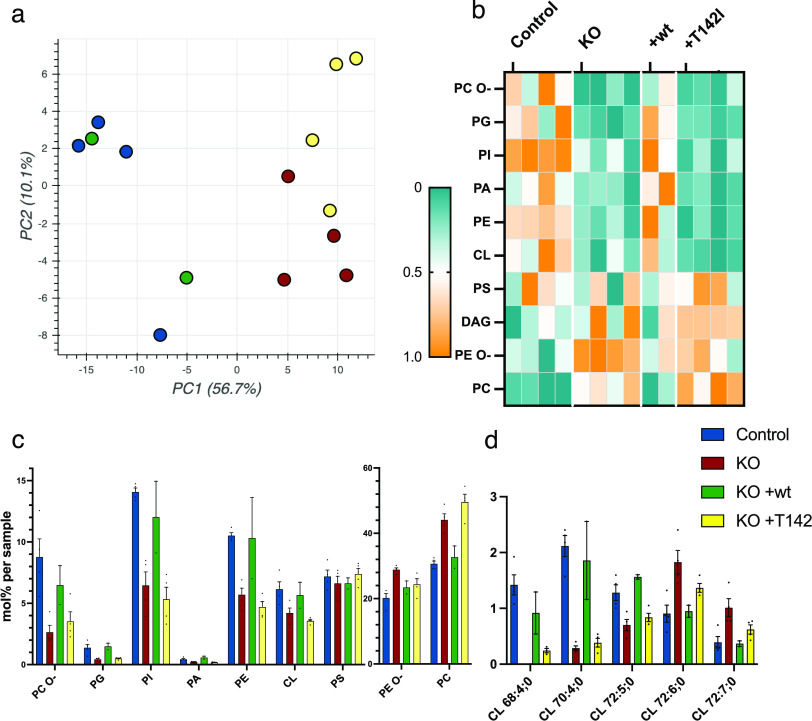
Figure 8. SLC25A46-dependent changes in the mitochondrial lipid profile.
Sucrose bilayer purified mitochondria from control human fibroblasts (control, n = 4), SLC25A46 knock-out fibroblasts (KO, n = 4), and SLC25A46 knock-out fibroblasts expressing either the WT protein (KO + wt, n = 2) or the pathogenic variant T142I (KO + T142I, n = 4) were analyzed for absolute quantification of lipid content using shotgun mass spectrometry lipidomics. (A) PCA of individual samples. (B) Heat map representing the relative abundance of the lipid classes (ether-linked phosphatidylcholine [PC O-], phosphatidylglycerol [PG], phosphatidylinositol [PI], phosphatidic acid [PA], phosphatidylethanolamine [PE], cardiolipin [CL], phosphatidylserine [PS], diacylglycerol [DAG], ether-linked PE [PE O-], and phosphatidylcholine [PC]) of the 203 significantly different lipid entities detected by mass spectrometry. Lipids were sorted by fold change between control and knock-out cell lines. Data were normalized within each class of lipids. (C) Lipid class profile represented as molar % of the total lipid amount (mol%). (D) Lipid species profile of cardiolipins. Data are presented as molar % of the total lipid amount (mol%).

