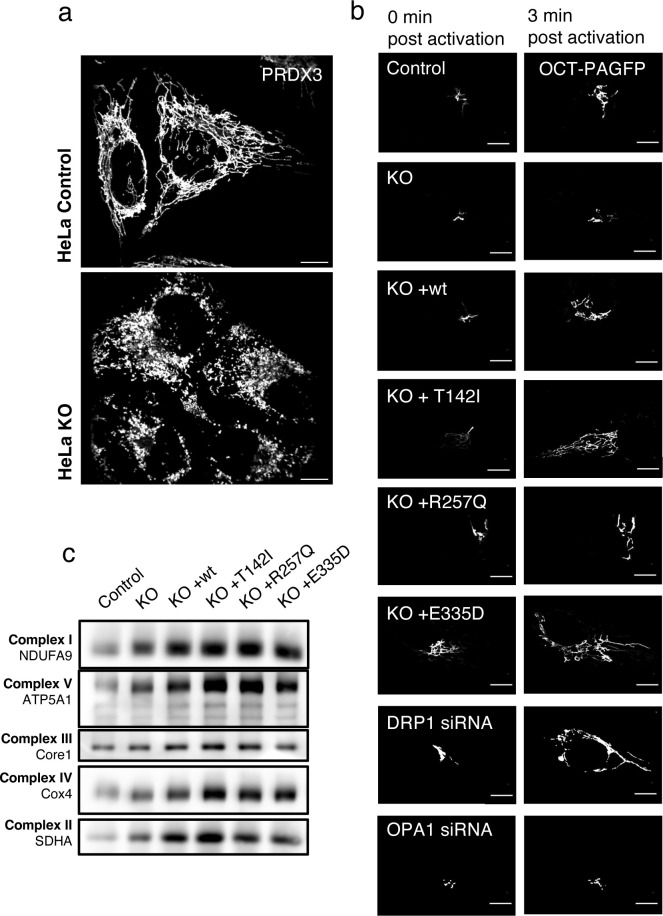
Figure S2. Physiological consequences of the SLC25A46 knock-out and the expression of pathogenic variants.
(A) Mitochondrial morphology of HeLa control cells and knock-out of SLC25A46. Representative images of cells decorated with anti-PRDX3 (mitochondria) in white. Scale bars: 10 μm. (B) Live-cell imaging analysis of fibroblasts expressing a mitochondrial-targeted photoactivatable GFP (OCT-PAGFP) probe. Representative images of the OCT-PAGFP probe diffusion over a 3-min period after activation with the 405-nm laser. Scale bars: 10 μm. (C) BN-PAGE analyses of OXPHOS complexes in fibroblasts from control and SLC25A46 knock-out cell lines, and cells expressing the WT protein or the pathogenic variants of SLC25A46. Each of the five OXPHOS complexes (I–V) was visualized with a subunit-specific antibody that recognizes the native complex.

