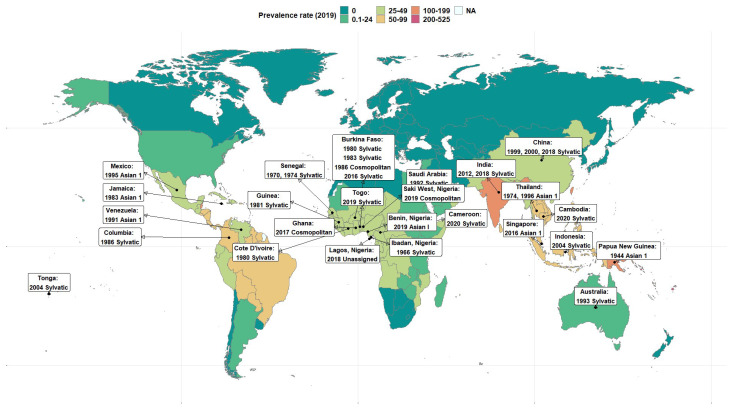
Figure 1.
Map showing the global prevalence rate of dengue in 2019 and DENV-2 isolates. Source of mapped prevalence data: Global Burden of Disease Collaborative Network. Global Burden of Disease Study 2019 (GBD 2019) Results. Seattle, United States: Institute for Health Metrics and Evaluation (IHME), 2020. Available from https://vizhub.healthdata.org/gbd-results/ accessed on 13 February 2023. All rates are expressed as age-standardized based on the GBD reference population.

