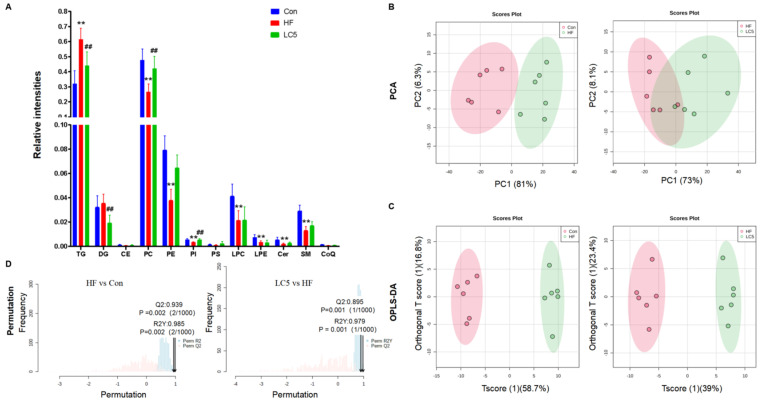
Figure 4.
Lipidomics analysis of hepatic lipid profiles in the experimental mice. (A) Bar diagram representing the relative intensities of lipid species in different groups; (B) PCA scores plots; (C) OPLS-DA of HF versus Con and LC5 versus HF groups, respectively; (D) permutation test of the OPLS-DA models; n = 6 each group; HF vs. Con: the intercepts of R2 = 0.985, Q2 = 0.939; LC5 vs. HF: R2 = 0.979, Q2 = 0.895. ** p < 0.01 to Con; ## p < 0.01 to HF.

