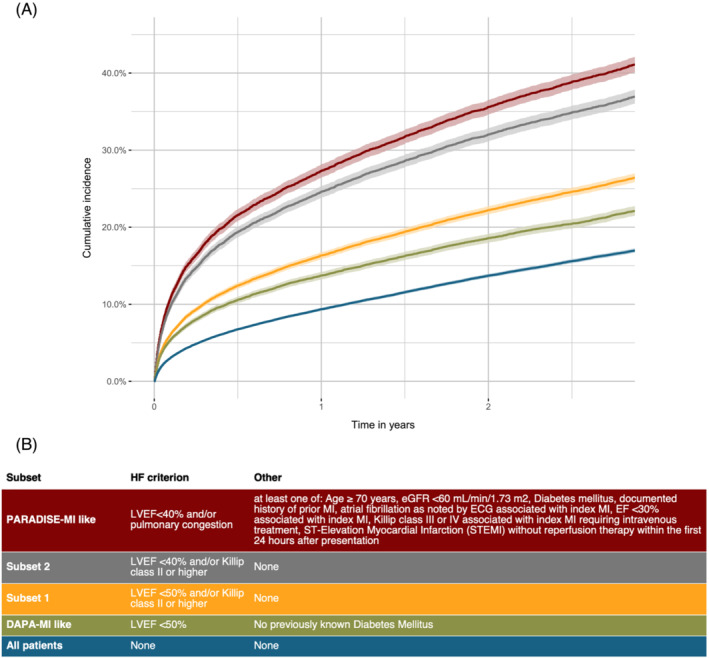
Figure 1.

A Kaplan–Meier curve showing time to the combined endpoint of all‐cause death or readmission for HF (primary diagnosis). Groups: subset 1: EF < 50% a/o pulmonary congestion; subset 2: EF < 40% a/o pulmonary congestion; subset 3/PARADISE‐MI like: EF < 40% a/o pulmonary congestion and high‐risk; subset 4/DAPA‐MI like: EF < 50% and no diabetes mellitus.
