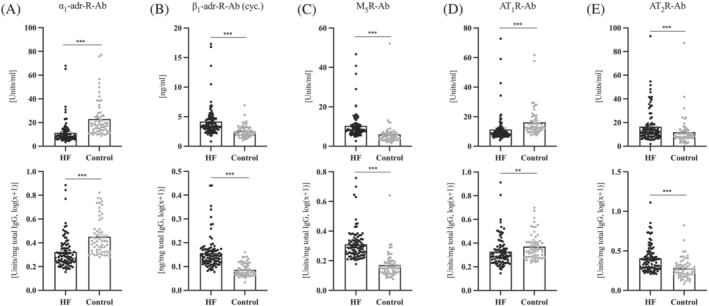
Figure 1.

Levels of GPCR‐Abs in the heart failure group and the control group. Top row: Native data. Bottom row: Data normalized to total IgG and log(x + 1) transformed. HF, heart failure; IgG, immunoglobulin G. (A) α1‐Adrenergic receptor antibodies. (B) β1‐Adrenergic receptor antibodies, measured via cyclic peptide assay. (C) Muscarinic receptor M5 antibodies. (D) Angiotensin II receptor type 1 antibodies. (E) Angiotensin II receptor type 2 antibodies. **P ≤ 0.01, ***P ≤ 0.001 vs. control group. P calculated using Mann–Whitney test. n = 95–91 vs. n = 60.
