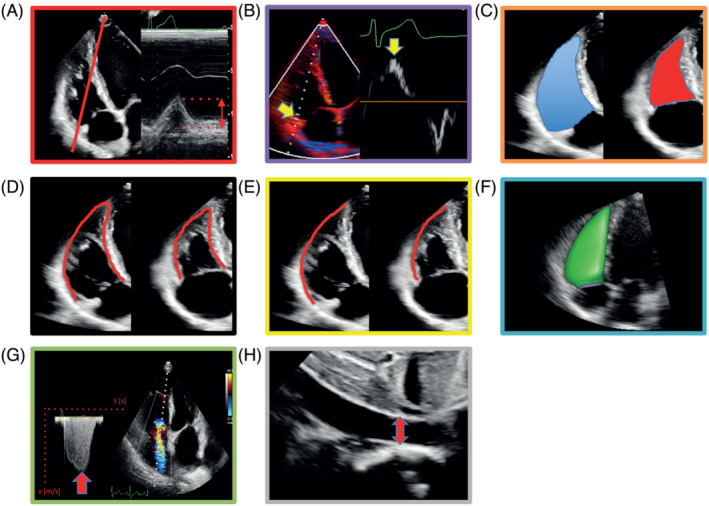
Figure 4.

Echocardiographic estimation of right ventricular (RV)–pulmonary arterial coupling. (A) Schematic of M‐mode‐derived tricuspid annular plane systolic excursion. (B) Schematic of peak systolic velocity of lateral tricuspid annulus (S′). (C) RV fractional area change is the planimetric percentage change of RV end‐diastolic (blue) to end‐systolic (red) area. (D, E) Schematics of speckle tracking‐based strain measurement: percentage of (D) whole RV and (E) RV free wall shortening. (F) Three‐dimensional RV volumetry. (G, H) Echocardiographic estimation of pulmonary arterial systolic pressure, based on (G) translation of peak tricuspid regurgitant velocity into trans‐tricuspid pressure gradient by modified Bernoulli equation and (H) addition of central venous pressure estimated from inferior vena cava diameter and respiratory alteration of inferior vena cava diameter.
