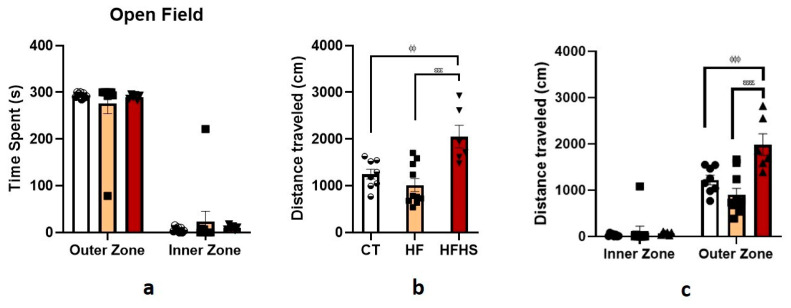
Figure 8.
Open-field test. Histograms display the mean ± SEM time spent (a) in the outer and inner zones of the open field, the total distance traveled during all acquisitions (b), and the distance traveled in the outer and inner zones during the test (c). No differences were found among the three groups in the time spent in the inner and outer zones. For the total distance traveled, the HFHS animals traveled longer distances than the HF and control animals. For the distance traveled in the different zones of the apparatus, HFHS animals traveled long distances in the outer zone than HF and controlled animals; no differences were found for the inner zone. ϕϕ p < 0.01; ϕϕϕ p < 0.001 HFHS versus controls; εεε p < 0.001; εεεε p < 0.0001 HFHS versus HF. The bars in white represent the mean for the control group, the bars in orange represent the mean for the HF group, and the bars in red represent the mean for the HFHS group. The circle represents the value for each animal in the control group, the square represents the value for each animal in the HF group, and the inverted triangle represents the value for each animal in the HFHS group.

