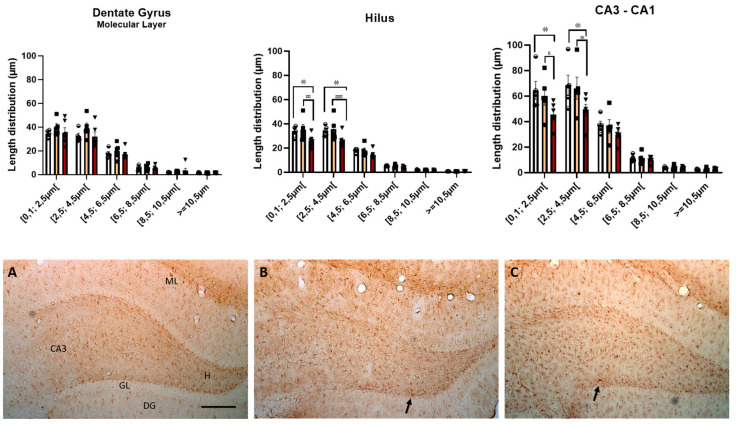
Figure 11.
HFHS rats displayed decreased astrocyte processes. The histograms show the mean ± SD length distribution of astrocyte processes in the three different regions of the hippocampus. There was a significant reduction in processes with a minor length distribution compared to the control and HF animals. ϕϕ p < 0.01 HFHS versus controls; ε p < 0.05; εε p < 0.01; εεε p < 0.001 HFHS versus HF animals. The bars in white represent the mean for the control group, the bars in orange represent the mean for the HF group, and the bars in red represent the mean for the HFHS group. The circle represents the value for each animal in the control group, the square represents the value for each animal in the HF group, and the inverted triangle represents the value for each animal in the HFHS group. Representative photomicrographs of level-matched coronal sections of the hippocampus formation from control (A), HF (B), and HFHS (C) rats immunostained for Glial Fibrillary Acidic Protein (GFAP). Arrows show GFAP-immunopositive cells in the hippocampus formation. ML, dentate gyrus molecular layer; GL, granule cell layer; H, dentate hilus; DG, dentate gyrus; CA3, pyramidal cell layer of CA3 hippocampal field. Scale bar = 100 µm.

