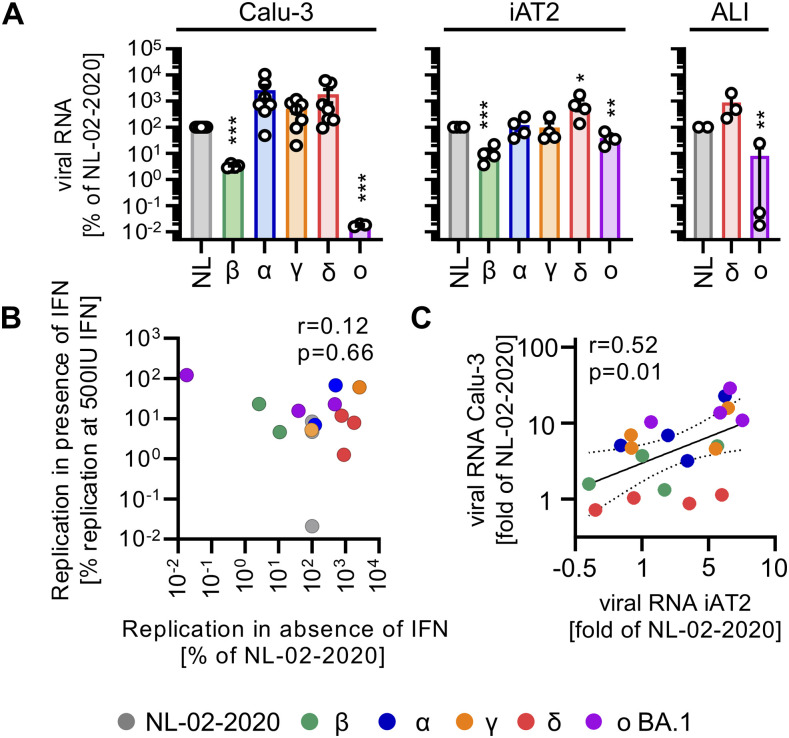
Figure 4. Comparative analysis of SARS-CoV-2 variants in Calu-3 cells, iAT2 cells, and ALI cultures.
(A) Normalized viral RNA in the supernatant of Calu-3 cells (left panel), iAT2 cells (middle panel) or ALI cultures (right panel, harvested from the apical surfaces) infected with indicated SARS-CoV-2 variants quantified by qRT–PCR at 2 d (Calu-3, iAT2) or 5 d (ALI cultures) postinfection (MOI 0.05, MOI 0.5, MOI 0.5 respectively). Bars represent the mean of n = 3–7 ± SEM or n = 3 individual donors (ALI cultures). (A, B) Scatter plot of viral RNA levels upon IFN treatment (average of all IFN treatments at 500 IU/ml or 100 ng/ml from Fig 1B) versus replication relative to NL-02-2020 (in Calu-3 cells from (A)) in the absence of IFN. (C) Scatter plot of viral RNA in the supernatant of Calu-3 or iAT2 cells as fold change compared with NL-02-2020 at maximum IFN concentrations (500 IU/ml or 100 ng/ml) (data from Figs 1B and 2B). Correlations in (B, C) (r and p) were calculated using Pearson’s correlation. (A) Statistical significance was calculated using t tests ((A), left and middle panel) or ratio paired t tests ((A), right panel). *P < 0.05; **P < 0.01; ***P < 0.001.

