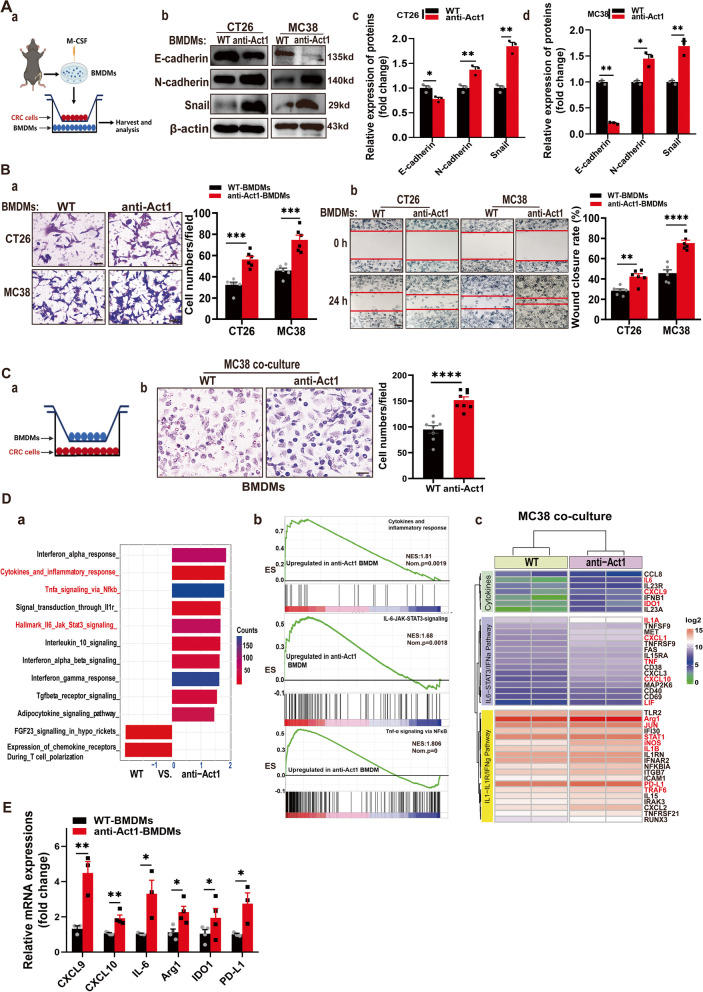
Fig. 3.
Macrophage-specific Act1 knockdown facilitated epithelial-mesenchymal transition and migration of CRC cells. (A) The effect of macrophage-specific Act1 knockdown on epithelial-mesenchymal transition markers in cocultured CT26 and MC38 cells. (a) Schematic representation of the experimental design. (b) Expression levels of epithelial-mesenchymal transition markers in CT26 and MC38 cells cocultured with macrophages for 48 h were evaluated by western blotting. (c-d) Quantification of immunoblotting results in CT26 and MC38 cells, respectively. (B) The effect of macrophage-specific Act1 knockdown on the migration of cocultured CRC cells. (a) Transwell migration assays of CT26 and MC38 cells after coculture with macrophages for 24 h. Scale bar, 50 μm. (b) Wound-healing assay was performed by creating a wound on a confluent monolayer of CT26 and MC38 cells during incubation with macrophages of wild type and anti-Act1 mice. Scale bar, 200 μm. (C) The effect of Act1 knockdown in BMDMs on the migration of BMDMs after coculture with MC38 cells for 48 h. (a) Schematic graph of coculture strategy; (b) Transwell migration assays of BMDMs after coculture with CRC cells for 24 h. Scale bar, 50 μm. (D) RNA sequencing of macrophages from wild type and anti-Act1 mice after coculture with MC38 cells for 24 h. (a) Differential GSEA enrichment of signaling pathways in macrophages of wild type and anti-Act1 mice. (b) Signaling pathways specifically enriched in anti-Act1 macrophage after coculture with MC38 cell line. (c) Differential expression of core genes in macrophages of wild type and anti-Act1 mice. (E) Quantitative assessment of core genes including CXCL9, CXCL10, IL-6, Arg1, IDO1, and PD-L1 by RT-qPCR, n = 3. Significant difference between the groups, *p < 0.05, **p < 0.01, ***p < 0.001, and ****p < 0.0001 (Student t test)

