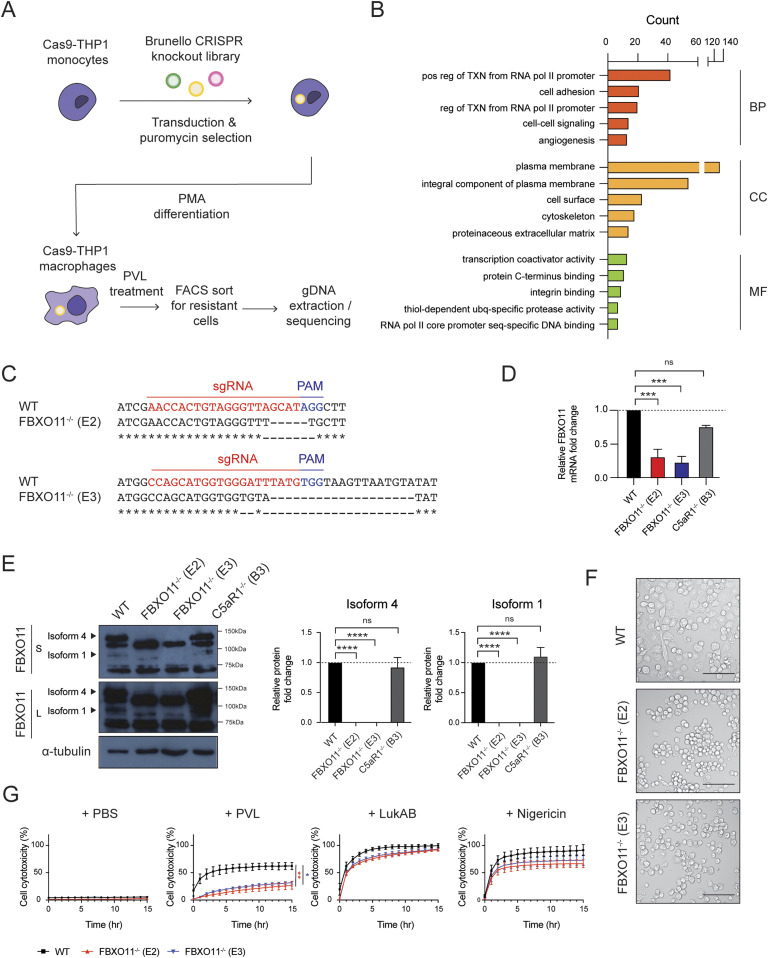
Figure 1. Genome-wide CRISPR/Cas9 screen identified FBXO11 as critical host factor required for PVL-mediated cell cytotoxicity.
(A) Schematic summary of genome-wide CRISPR/Cas9 screen. (B) Top 5 GO term enrichment analysis of 585 statistically significant (P-value < 0.05) candidates identified in genome-wide CRISPR/Cas9 screen. Candidates were categorised into biological process (BP), cellular component (CC), and molecular function (MF), and the x-axis represents the gene counts. (C) Data from DNA sequencing showing sgRNA target sites (highlighted in red) and PAM sequence (highlighted in blue). (D) qRT-PCR analysis of FBXO11 mRNA in WT, FBXO11−/−, and C5aR1−/− macrophages. FBXO11 mRNA levels were normalised to GAPDH, and fold change relative to WT shown. Mean ± SEM of three independent biological replicates shown. ns = not significant; *** = P < 0.001; by one-way ANOVA followed by Dunnett’s multiple comparison test. (E) Immunoblot analysis of FBXO11 isoform 4 and 1 in WT, FBXO11−/−, and C5aR1−/− macrophages. Protein abundance was normalised to α-tubulin and represented as fold change compared with WT macrophages. Mean ± SEM of three independent biological replicates shown. ns = not significant; **** = P < 0.0001; by one-way ANOVA followed by Dunnett’s multiple Ccomparison test. (F) Brightfield microscopy showing morphology of WT and FBXO11−/− macrophages following PMA differentiation. Scale bar corresponds to 100 μm. (G) Live cell imaging showing the percentage of Draq7-positive (dead) WT and FBXO11−/− macrophages treated with PBS, PVL (62.5 ng/ml), LukAB (62.5 ng/ml), and nigericin (10 μM). Mean ± SEM of three independent biological replicates shown. * = P < 0.05 for WT versus FBXO11−/− (E3) at 15 h post toxin treatment; ** = P < 0.01 for WT versus FBXO11−/− (E2) at 15 h post toxin treatment; by unpaired t test.
Source data are available for this figure.

