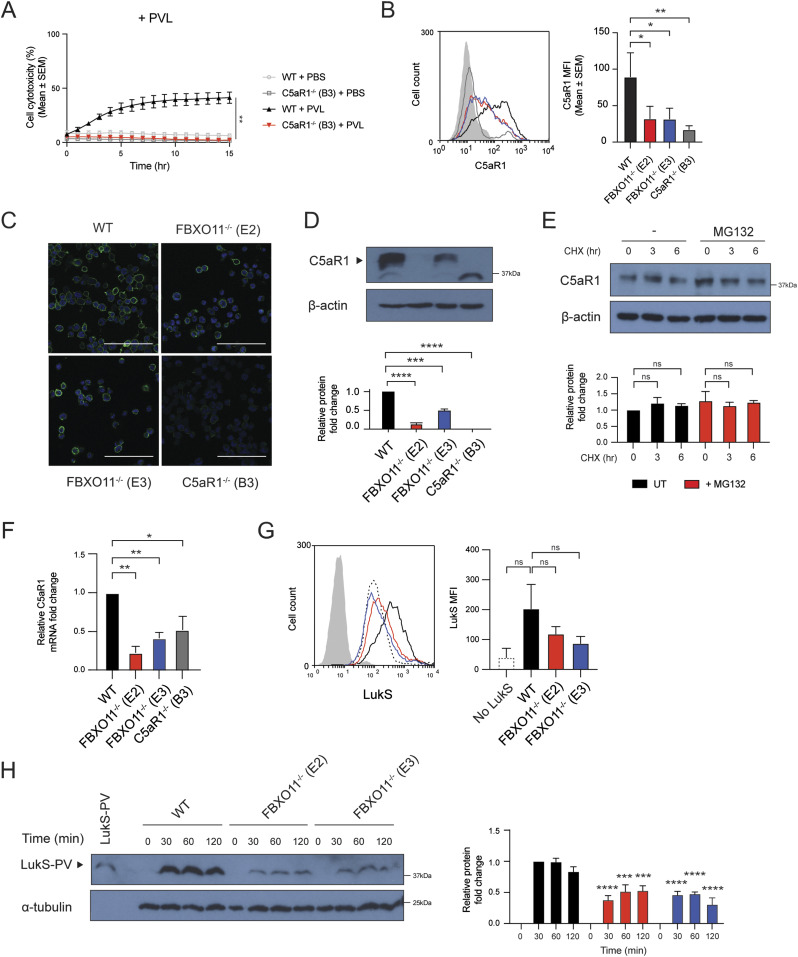
Figure 2. FBXO11−/− macrophages have reduced C5aR1 cell surface expression.
(A) Live cell imaging showing the percentage of Draq7-positive (dead) WT and C5aR1−/− macrophages to PBS or PVL (62.5 ng/ml). Mean ± SEM of three independent biological replicates shown. ** = P < 0.01 for WT versus C5aR1−/− at 15 h post toxin treatment; by unpaired t test. (B) Flow cytometric analysis and median fluorescence intensity of C5aR1 cell surface expression. Grey line represents isotype negative control, black line represents WT macrophages, red and blue lines represent FBXO11−/− (E2 and E3, respectively), and dark grey line represents C5aR1−/− macrophages. Mean ± SEM of three independent biological replicates shown. * = P < 0.05, ** = P < 0.01; by one-way ANOVA followed by Dunnett’s multiple comparison test. (C) Confocal microscopy images of WT, FBXO11−/−, and C5aR1−/− macrophages. PFA-fixed cells were stained using anti-C5aR1 (green), and nuclei were stained with DAPI (blue). Scale bar corresponds to 100 μM. (D) Immunoblot analysis of C5aR1 in WT, FBXO11−/−, and C5aR1−/− macrophages. Protein abundance was normalised to β-actin and represented as fold change compared with WT macrophages. Mean ± SEM of three independent biological replicates shown. *** = P < 0.001, **** = P < 0.0001; by one-way ANOVA followed by Dunnett’s multiple comparison test. (E) Immunoblot analysis of C5aR1 in WT macrophages that were treated with CHX (20 μg/ml) with or without MG132 for the indicated amount of time before cell lysate collection. Protein abundance was normalised to β-actin and represented as fold change compared with WT macrophage. Mean ± SEM of three independent biological replicates shown. ns = not significant; by two-way ANOVA with Sidak’s multiple comparisons test. (F) qRT-PCR analysis of C5aR1 mRNA in WT, FBXO11−/−, and C5aR1−/− macrophages. C5aR1 levels were normalised to GAPDH, and fold change relative to WT macrophage shown. Mean ± SEM of three independent biological replicates shown. * = P < 0.05, ** = P < 0.01; by one-way ANOVA followed by Dunnett’s multiple comparison test. (G) Flow cytometric analysis and MFI of recombinant LukS-PV subunit binding to WT and FBXO11−/− macrophages. Grey line represents isotype, dotted black line represents no LukS-PV negative control, solid black line represents WT macrophages, and red and blue lines represent FBXO11−/− macrophages treated with LukS-PV (E2 and E3, respectively). *** = P < 0.001, **** = P < 0.0001; by two-way ANOVA with Sidak’s multiple comparisons test. (H) Western blot analysis of WT and FBXO11−/− macrophages treated with LukS-PV over time. Protein abundance was normalised to α-tubulin and represented as fold change compared with WT macrophages at respective time points. Recombinant LukS-PV is included in the left lane. Mean ± SEM of three independent biological replicates shown. *** = P < 0.001, **** = P < 0.0001;by two-way ANOVA with Sidak’s multiple comparisons test.
Source data are available for this figure.

