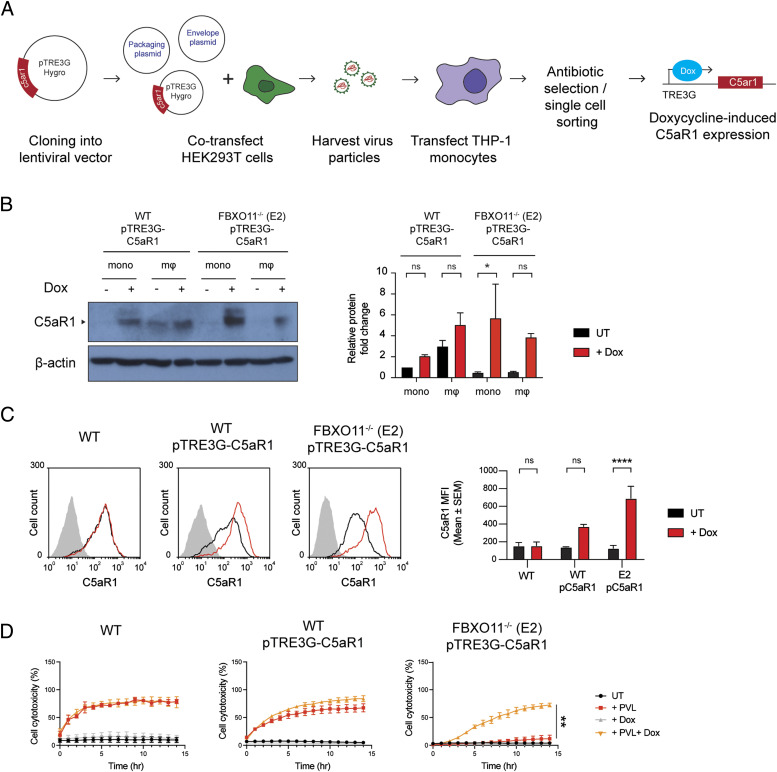
Figure 3. Ectopic expression of C5aR1 restores cell susceptibility to PVL.
(A) Graphical summary of the generation of doxycycline inducible C5aR1 overexpression THP1 monocytes using the lentiviral vector pTRE3G-C5aR1. (B) Western blot analysis of C5aR1 in pTRE3G-C5aR1 transfected cells—WT-pTRE3G-C5aR1 and FBXO11−/− (E2) pTRE3G-C5aR1 THP1 monocytes and macrophages. Cells were treated with or without doxycycline (1 μg/ml) for 24 h to induce C5aR1 expression. Abbreviations: macrophages (mΦ); monocytes (mono); doxycycline (Dox). Protein abundance was normalised to β-actin and represented as fold change compared with untreated cells. Mean ± SEM of three independent biological replicates shown. ns = not significant, * = P < 0.05; by two-way ANOVA with Sidak’s multiple comparisons test. (C) Flow cytometric analysis and MFI of C5aR1 cell surface expression on WT and FBXO11−/− (E2) macrophages treated with (black line) or without (red line) doxycycline (1 μg/ml). The grey line represents isotype negative control. Representative of three independent experiments. ns = not significant, **** = P < 0.0001; by two-way ANOVA with Sidak’s multiple comparisons test. (D) Live cell imaging showing the percentage of Draq7-positive (dead) untransfected WT macrophages, and pTRE3G-C5aR1 transfected WT and FBXO11−/− (E2) macrophages to PVL (125 ng/ml). Cells were treated with or without doxycycline (1 μg/ml) for 24 h before toxin treatment. Mean ± SEM of three independent experiments shown. ** = P < 0.01 for “+PVL” versus “+PVL +Dox” at 15 h post toxin treatment; by unpaired t test.
Source data are available for this figure.

