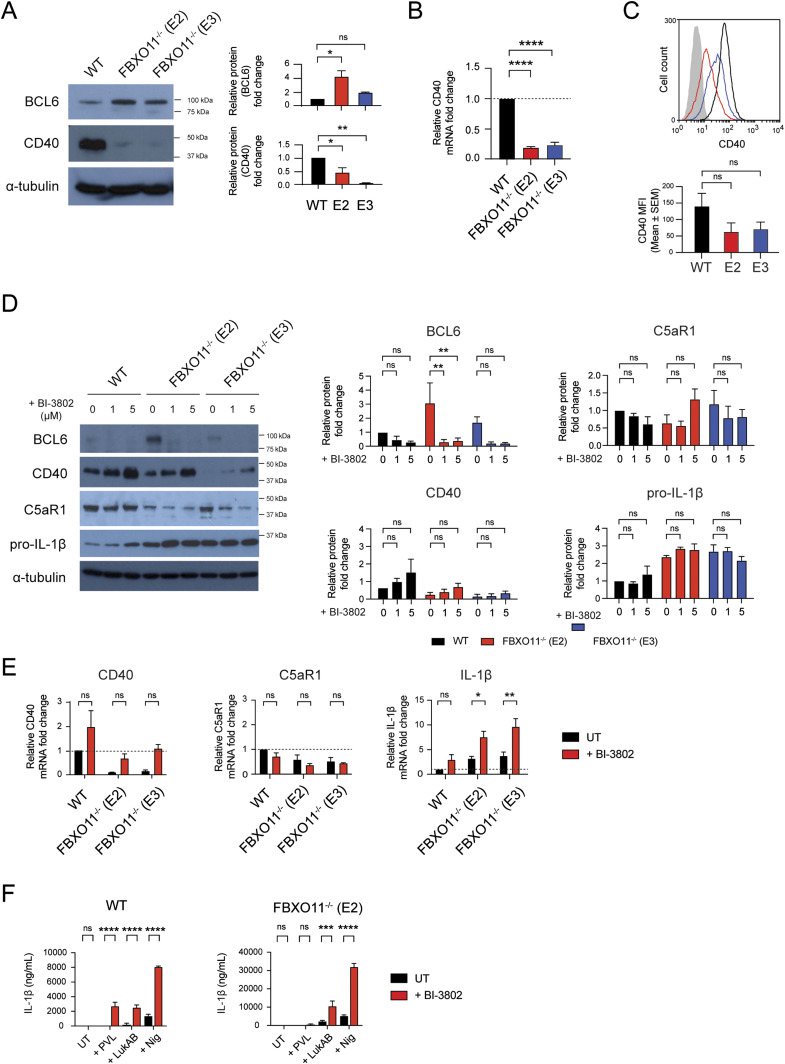
Figure 6. Loss of BCL-6 promotes CD40 and IL-1β but not C5aR1 expression.
(A) Western blot analysis of BCL-6 and CD40 in WT and FBXO11−/− macrophage whole-cell lysate. Protein abundance was normalised to α-tubulin and represented as fold change compared with untreated WT macrophages. Mean ± SEM of three independent biological replicates shown. ns = not significant, * = P < 0.05, ** = P < 0.01; by one-way ANOVA followed by Dunnett’s multiple comparison test. (B) qRT-PCR analysis of CD40 mRNA in WT and FBXO11−/− macrophages. CD40 mRNA levels were normalised to GAPDH, and fold change relative to WT macrophage shown. Mean ± SEM of three independent biological replicates shown. **** = P < 0.0001; by one-way ANOVA followed by Dunnett’s multiple comparison test. (C) Flow cytometric analysis and MFI of CD40 cell surface expression. Grey line represents isotype negative control, black line represents WT macrophages, and red and blue lines represent FBXO11−/− macrophages (E2 and E3, respectively). Mean ± SEM of three independent biological replicates shown. ns = not significant; by one-way ANOVA followed by Dunnett’s multiple comparison test. (D) Western blot analysis of BCL-6, CD40, C5aR1, and IL-1β in WT and FBXO11−/− macrophage whole-cell lysate treated with or without BI-3802 (1 or 5 μM) during recovery period. Protein abundance was normalised to α-tubulin and represented as fold change compared with untreated WT macrophages at respective time points. Mean ± SEM of three independent biological replicates shown. ns = not significant; * = P < 0.05, ** = P < 0.01, *** = P < 0.001; by two-way ANOVA with Sidak’s multiple comparisons test. (E) qRT-PCR analysis of CD40, C5aR1, and IL-1β mRNA in WT and FBXO11−/− macrophages treated with or without BI-3802 (5 μM). mRNA levels were normalised to GAPDH, and fold change relative to WT macrophage shown. Mean ± SEM of three independent biological replicates shown. ns = not significant; * = P < 0.05, ** = P < 0.01; by two-way ANOVA with Sidak’s multiple comparisons test. (F) BI-3802 (5 μM) untreated or treated WT, FBXO11−/− (E2) macrophages were treated with PVL (62.5 ng/ml), LukAB (62.5 ng/ml) or nigericin (10 μM) for 2 h. Il-1β levels in culture supernatants were determined by ELISA. Mean ± SEM of three independent biological replicates shown. ns = not significant; ** = P < 0.01, *** = P < 0.001, **** = P < 0.0001; by two-way ANOVA followed by Sidak’s multiple comparisons test. Abbreviation: Nig, nigericin.
Source data are available for this figure.

