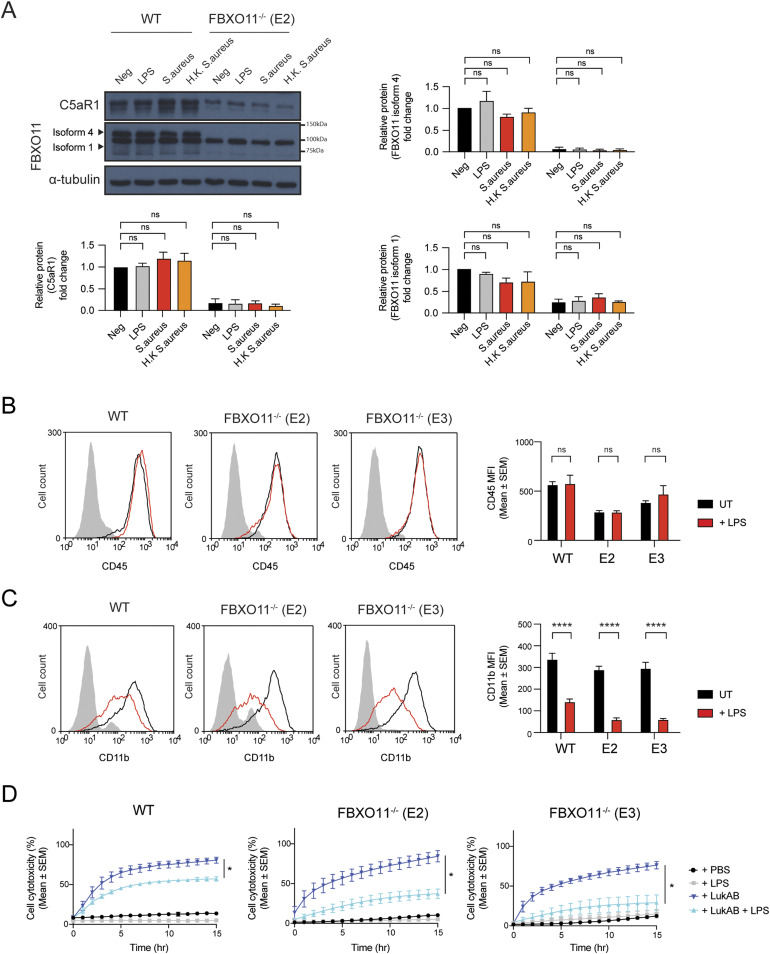
Figure S3. Effect of LPS treatment on CD45 and CD11b expression.
(A) Western blot analysis of C5aR1 and FBXO11 protein expression in WT and FBXO11−/− (E2) macrophages, exposed to LPS (100 ng/ml), S. aureus (MOI 10), or heat-killed S. aureus (MOI 10) for 3 h. Protein abundance was normalised to α-tubulin and represented as fold change compared with untreated WT macrophages. Mean ± SEM of three independent biological replicates shown. ns = not significant; by two-way ANOVA with Sidak’s multiple comparisons test. (B, C) Flow cytometric analysis and MFI of (B) CD45 and (C) CD11b protein expression in untreated (black line) and LPS-treated (red line) WT, and FBXO11−/− macrophages. Mean ± SEM of three independent biological replicates shown. ns = not significant; **** = P < 0.0001; by two-way ANOVA with Sidak’s multiple comparisons test. (D) Live cell imaging showing the percentage of Draq7-positive (dead) LPS-treated WT and FBXO11−/− macrophages treated with LukAB (62.5 ng/ml). Mean ± SEM of three independent biological replicates shown. * = P < 0.05 for +LukAB versus + LukAB +LPS at 15 h post toxin treatment; by unpaired t test.
Source data are available for this figure.

