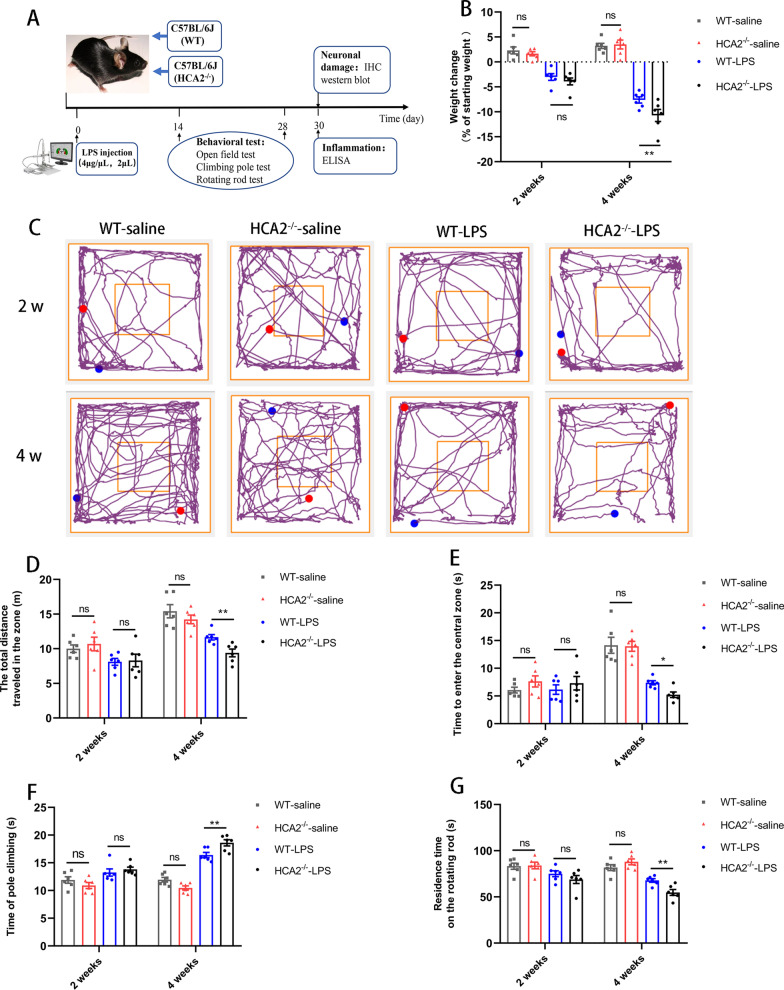
Fig. 1.
Effect of HCA2 on body weight loss and exercise capacity in mice. A Experimental flowchart. B Changes in the body weight of mice before and after the experiment. C Movement trajectories of mice in the open field. D Total distance traveled by mice in the open field. E Residence time of mice in the center box. F The time mice took for climbing the pole. G The time that the mice did not fall on the rotarod fatigue apparatus. Results are presented as mean ± SD (n = 6). *p < 0.05, **p < 0.01 means significant difference and ns means no significant difference

