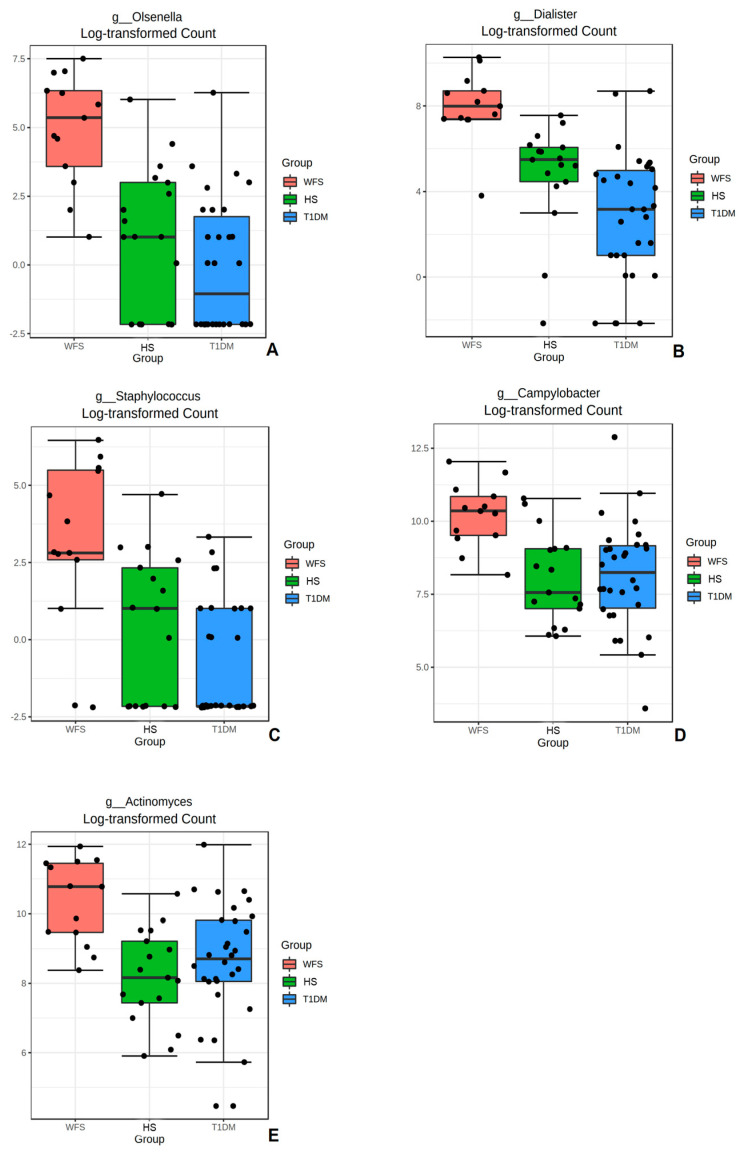
Figure 5.
Boxplots comparing abundance for the groups studied for selected bacterial genera: (A). Olsenella; (B). Dialister; (C). Staphylococcus; (D). Campylobacter; and (E). Actinomyces. WFS—Wolfram syndrome; HS—healthy subjects; T1DM—Type 1 diabetes mellitus. Significant differences in abundance of bacteria genera among the three groups were identified using ANOVA; p < 0.001 in all presented bacteria.

