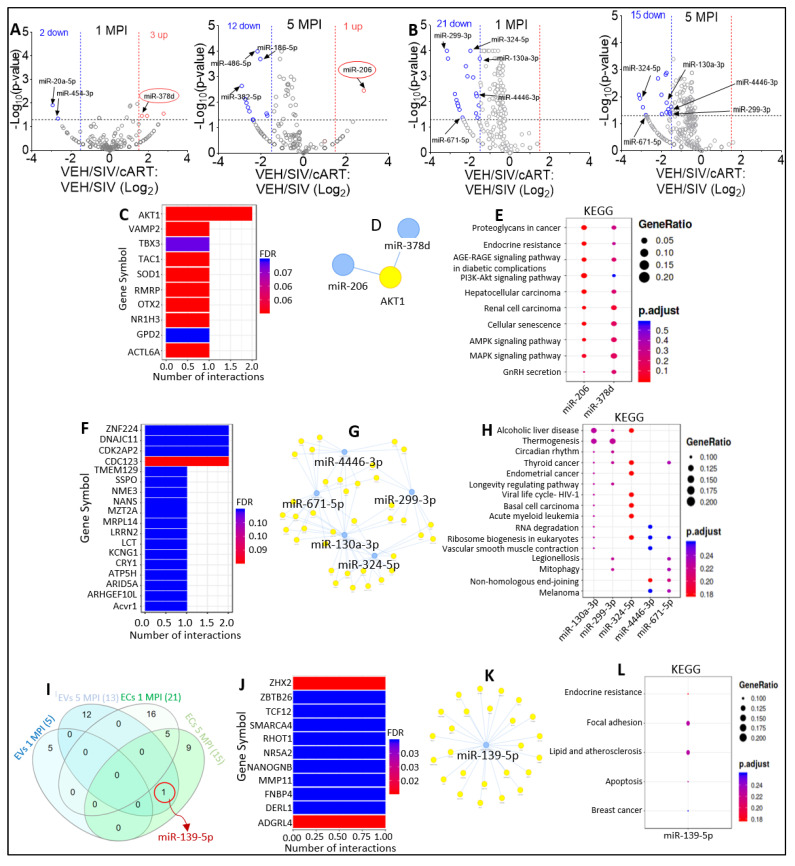
Figure 3.
Varying miRNA abundance in EVs and ECs in response to SIV infection and cART. (A) Volcano plot showing down-(blue) regulated and up-(red) regulated miRNAs in VEH/SIV/ART EVs relative to VEH/SIV EVs at 1 MPI (left) and 5 MPI (right) as shown by black arrows. Red circle indicates miRNAs (miR-378d, miR-206) suppressed by SIV infection in Figs. 5C, 5E of Manuscript 1. (B) Volcano plot showing down-(blue) regulated miRNAs in SIV/ART ECs relative to SIV ECs at 1 MPI (left) and 5 MPI (right). Black arrows indicate miRNAs shown to be significantly downregulated at 1 MPI and 5 MPI. (C) miRNA-target enrichment analysis showing top target genes by # of interactions for miR-206 and miR-378d. (D) Visualization of miRNA-target interaction network for miR-206 and miR-378d. The blue circles represent the miRNAs, while the target genes are represented by the yellow circles. Pathways are represented by blue lines. (E) Dot plot of functional enrichment analysis for target genes of miR-206 and miR-378d. Color of dots represent adjusted p-values (FDR) and size of dots represents gene ratio (number of miRNA targets found enriched in each category/number of total genes associated to that category. (F) miRNA-target enrichment analysis showing top target genes by number of interactions for the 5 EC-associated miRNAs significantly downregulated at 1 MPI and 5 MPI; miR-299-3p, miR-324-5p, miR-4446-3p, miR-299-3p, and miR-671-5p. (G) Visualization of miRNA-target interaction network for miR-299-3p, miR-324-5p, miR-4446-3p, miR-299-3p, and miR-671-5p. The blue circles represent the miRNAs, while the target genes are represented by the yellow circles. Pathways are represented by blue lines. (H) Dot plot of functional enrichment analysis for target genes of miR-299-3p, miR-324-5p, miR-4446-3p, miR-299-3p, and miR-671-5p. Color of dots represent adjusted p-values (FDR) and size of dots represents gene ratio (number of miRNA targets found enriched in each category/number of total genes associated with that category). (I) Venn diagram comparing significantly modulated miRNAs in EVs and ECs at 1 MPI and 5 MPI. Red circle indicates miRNA (miR-139-5p) that was found to be significantly downregulated at 5 MPI in both EVs and ECs. (J) miRNA-target enrichment analysis showing top target genes by number of interactions for miR-139-5p. (K) Visualization of miRNA-target interaction network for miR-139-5p. The blue circles represent the miRNAs, while the target genes are represented by the yellow circles. Pathways are represented by blue lines. (L) Dot plot of functional enrichment analysis for miR-139-5p. Color of dots represent adjusted p-values (FDR) and size of dots represent gene ratio (number of miRNA targets found enriched in each category/number of total genes associated to that category).

