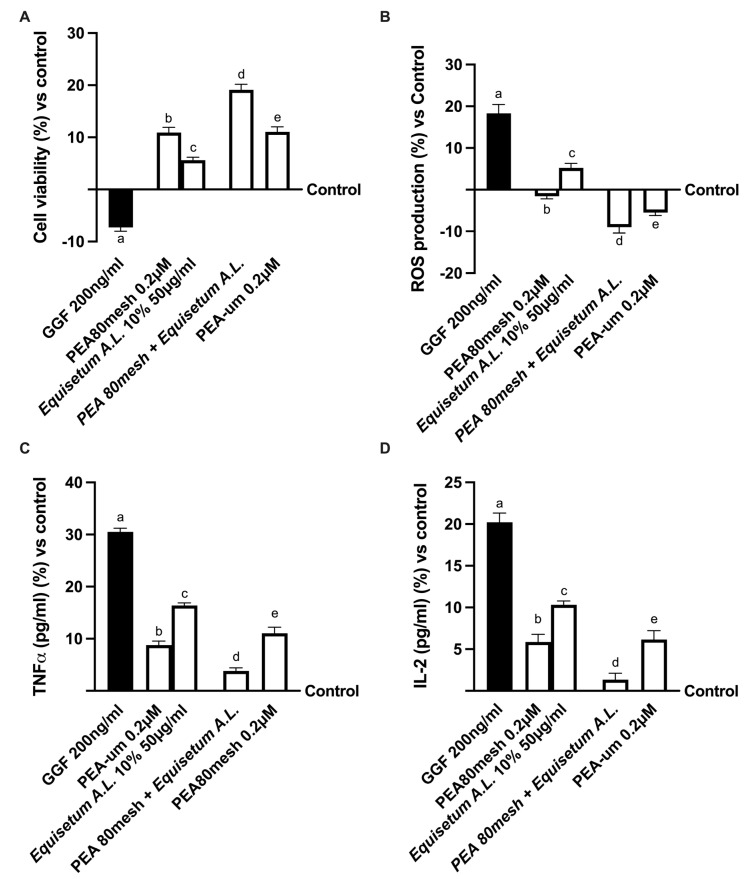
Figure 3.
Analysis of PEA 80mesh plus Equisetum A.L. effects under PNI conditions In (A) mitochondrial metabolism by MTT; in (B) nerve growth factor (NGF) determination by ELISA test; in (C) TNFa quantification by ELISA test; and in (D) IL-1b analysis by ELISA test. The data are the means ± SD (%) of five independent experiments performed in triplicate and normalized to control values (0% line). GGF = glial growth factor 2; the other abbreviations are the same as those reported in Figure 1. In (A): a–e p < 0.05 vs. control; a p < 0.05 vs. b–e; b p < 0.05 vs. c, d; c p < 0.05 vs. d, e; d p < 0.05 vs. e. In (B): a, c–e p < 0.05 vs. control; a p < 0.05 vs. b–e; b p < 0.05 vs. c, d; c p < 0.05 vs. d, e; d p < 0.05 vs. e. In (C): a–c, e p < 0.05 vs. control; a p < 0.05 vs. b–e; b p < 0.05 vs. c–e; c p < 0.05 vs. d, e; d p < 0.05 vs. e. In (C): a–c, e p < 0.05 vs. control; a p < 0.05 vs. b–e; b p < 0.05 vs. c, d; c p < 0.05 vs. d, e; d p < 0.05 vs. e. In (D): a–c, e p < 0.05 vs. control; a p < 0.05 vs. b–e; b p < 0.05 vs. c, d; c p < 0.05 vs. d, e; d p < 0.05 vs. e.

