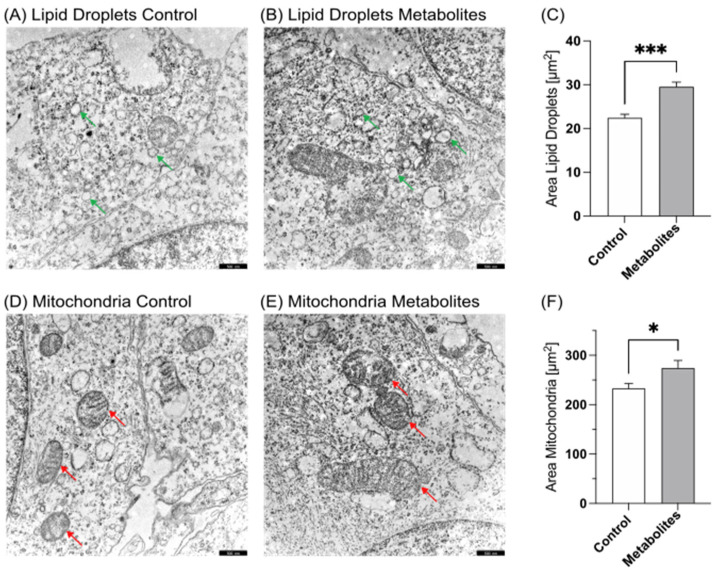
Figure 2.
Transmission electron microscopy of SH-SY5Y wild-type cells. (A) Control-treated SH-SY5Y cells at 12,000× magnification. Green arrows mark lipid droplets. (B) SH-SY5Y cells treated with aspartame metabolites at 12,000× magnification. Green arrows mark lipid droplets. (C) Comparison of the area of lipid droplets in control- and aspartame metabolite-treated cells in a bar chart. Error bars represent the standard error of the mean (SEM). The statistical significance was set as *** p ≤ 0.001. (D) Control-treated SH-SY5Y cells at 12,000× magnification. Red arrows show mitochondria. (E) SH-SY5Y cells treated with aspartame metabolites at 12,000× magnification. Red arrows show mitochondria. (F) Comparison of the area of mitochondria in control- and aspartame metabolite-treated cells. Error bars represent the standard error of the mean (SEM). The statistical significance was set as * p ≤ 0.05. Scale bars for (A,B,D,E): 500 nm.

