Figure 6.
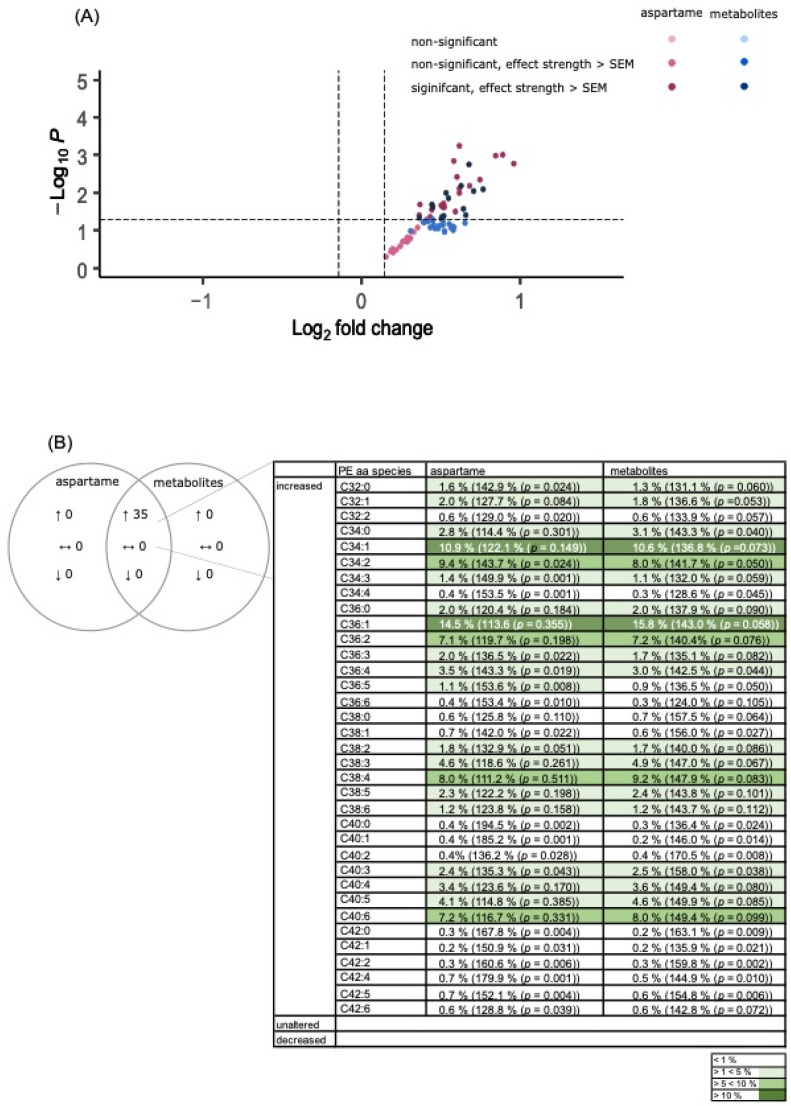
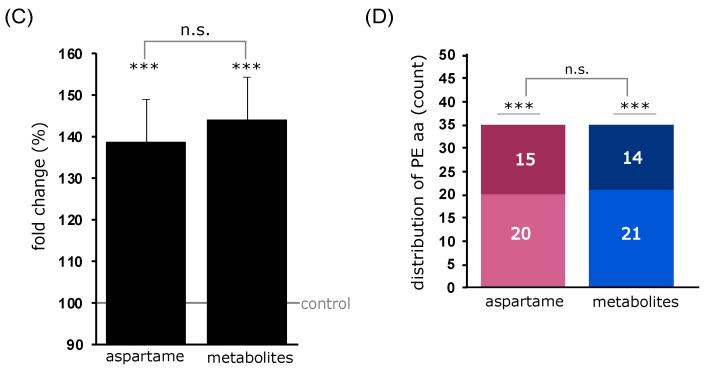
Effects of aspartame or aspartame metabolites on phosphatidylethanolamine (PEaa) species. Neuroblastoma cells (SH-SY5Y) were treated as described before with control, aspartame, or aspartame metabolites for 48 h and analyzed using a semi-quantitative shotgun lipidomics approach. Each diagram represents the changes in the aspartame- or metabolite-treated cells in comparison to control-treated cells. (A) In the volcano plot, each PEaa species is graphically represented by a pink (aspartame treatment) or blue (aspartame metabolite treatment) dot which is plotted with its fold change (x-axis) against its according p-value (y-axis). The volcano plot is structured as the one in Figure 4. (B) Venn diagram of Peaa species after incubation of SH-SY5Y cells with aspartame or aspartame metabolites. Alterations of the same species are visible in the overlapping part. (C) The bar chart shows the relative fold change of all measured Peaa species after aspartame treatment compared to treatment with aspartame metabolites. Error bars represent the standard error of the mean (SEM), and the statistical significance was set as *** p ≤ 0.001. (D) Distribution of PEaa species, classified by the amount of increased or decreased PEaa species. The bar chart is structured as the one in Figure 4. The applied statistical analyses are described in detail in Section 2.9 (n.s. not significant).


