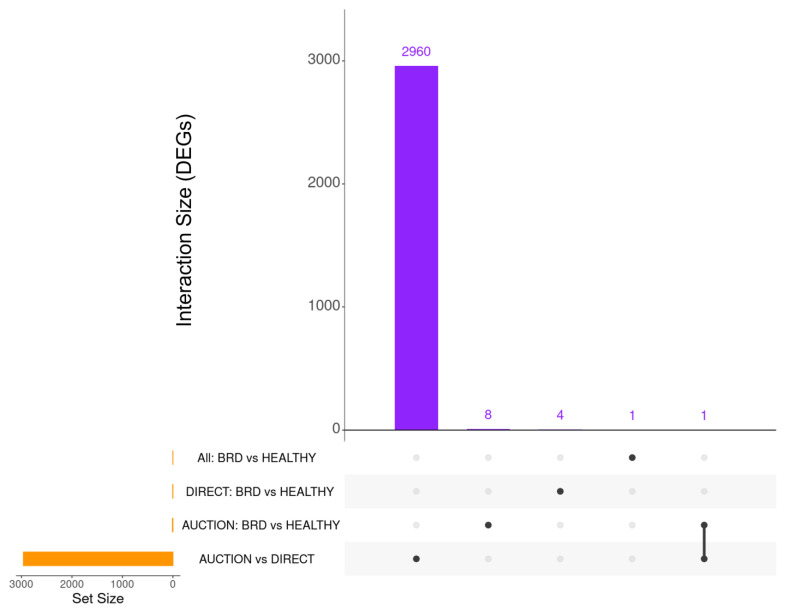
Figure 2.
Upset plot representing the total number of DEGs identified by each analysis (Set Size) and the number of DEGs overlapping between analyses (Interaction Size). AUCTION versus DIRECT demonstrated the greatest number of unique DEGs (2960) across all analyses, with only one overlapping gene identified between any of the four analyses (RN18S1; AUCTION versus DIRECT and BRD versus HEALTHY in AUCTION cattle).

