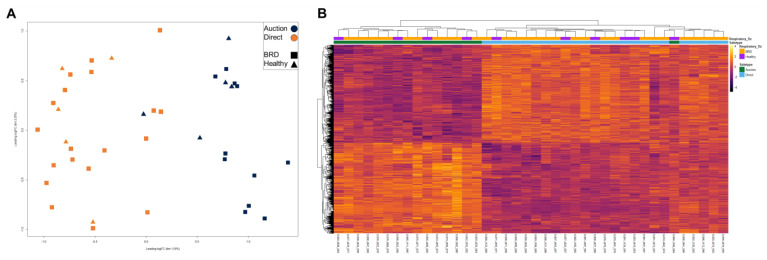
Figure 3.
Multidimensional scaling (MDS) and unsupervised hierarchical clustering of gene expression between all AUCTION and DIRECT cattle at facility arrival. (A) Points within the MDS plot represent each sample and their transformed Euclidean distance in the first two principal components, observed as the leading log2-fold change between the common distances of the top 500 genes that best differentiate each sample. (B) Heatmap and hierarchical clustering of the 2961 DEGs identified between all AUCTION and DIRECT cattle. Gene expression values were scaled and normalized with z-scores calculated from log2 count-per-million transformed, Trimmed Mean of M-values (TMM)-normalized counts. Samples were labeled according to BRD acquisition (Respiratory_Dz) and method of sale (Saletype). Relative expression of each gene is depicted from high (yellow/white) to low (purple/black) within each sample.

