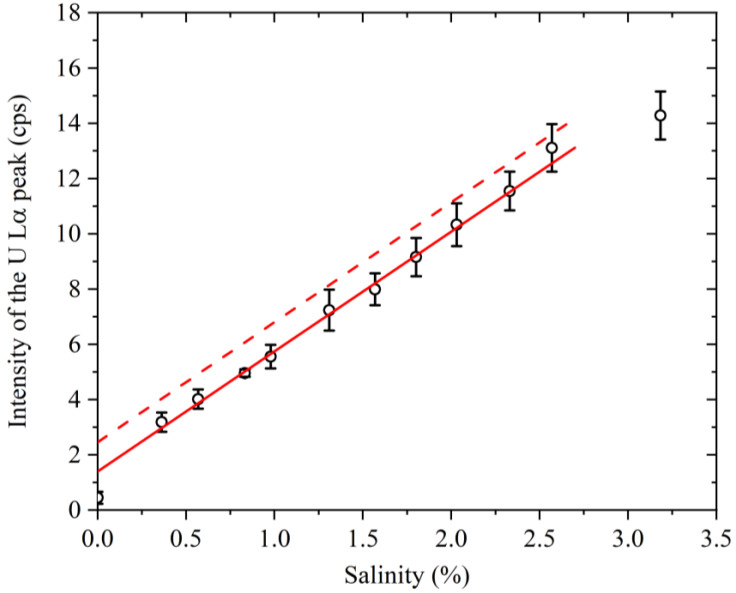
Figure 6.
Relationship between the salinity and intensity of the U Lα peak. The error bars represent the standard deviations of the results obtained from six samples. The solid line is the result of linear fitting of the data set with a salinity range of 0.57–2.57%. The dotted line is the result of a vertical shift by an amount of signal intensity (1.1 cps) corresponding to the detection limit (DL).

