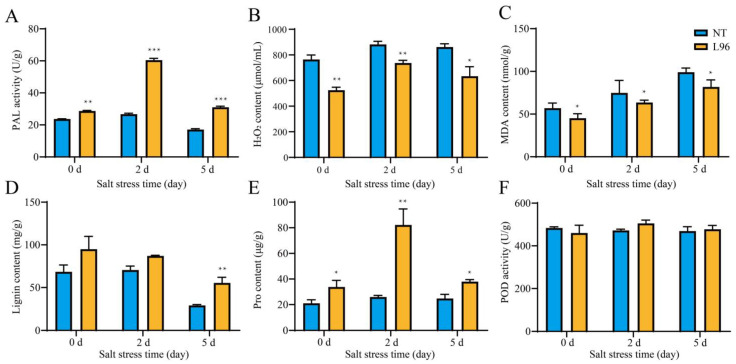
Figure 1.
Physiological indices of NT and L96 plant under salt stress. Changes in the contents of (A) PAL, (B) H2O2, (C) MDA, (D) lignin, (E) Pro, and (F) POD in NT and L96 under salt stress (150 mM NaCl). Data represent the mean ± SD from three biological replicates. Significance was determined by the least significant difference, and asterisks indicate statistically significant differences from NT (* p < 0.05, ** p < 0.01, *** p < 0.001).

