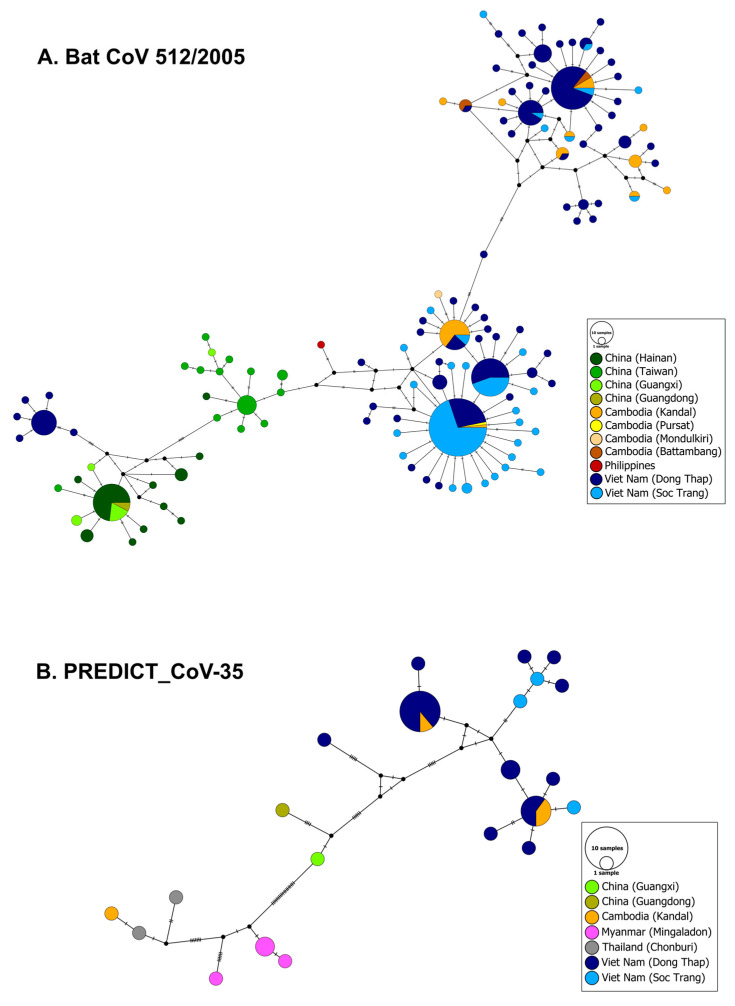
Figure 5.
Median-joining networks of (A) bat CoV 512/2005 (RdRp gene, [36], 393 bp), and (B) PREDICT_CoV-35 (RdRp gene, [36], 393 bp). Circles correspond to distinct viral sequences and circle sizes are proportional to the number of identical sequences in the dataset. Small black circles represent median vectors (ancestral or unsampled intermediate sequences). The numbers of mutational steps between sequences are represented as hatch marks along branches.

