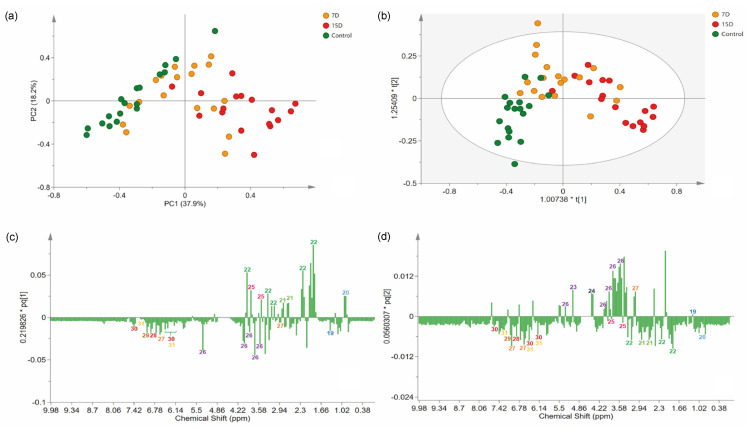
Figure 4.
Multivariate analysis of 1H-NMR data of the hydroalcoholic leaf extract of Bauhinia ungulata specimens submitted to different water irrigation periods. (a) Score scatter plot of principal component analysis (PCA), showing three groups of samples according to water irrigation periods. (b) Orthogonal projections of latent structure discriminant analysis (OPLS-DA) score plot. (c,d) Loadings plot from the OPLS-DA, displayed as columns. Numbers in the columns indicate the identified features. The color of the number indicates the class of the compounds according to Classyfire and mapped in the molecular network (see Figure 1).

