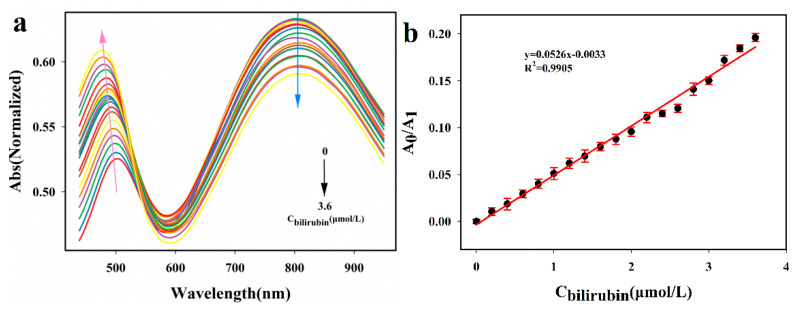
Figure 5.
Absorption spectra of GNCs responding to different concentrations (0.2, 0.4, 0.6, 0.8, 1, 1.2, 1.4, 1.6, 1.8, 2, 2.2, 2.4, 2.6, 2.8, 3, 3.2, 3.4, 3.6 μmol/L) of bilirubin (a) and the linear response curve (b) (the error bar was expressed as ± σ, and σ is the mean value and standard deviation (n = 3)).

