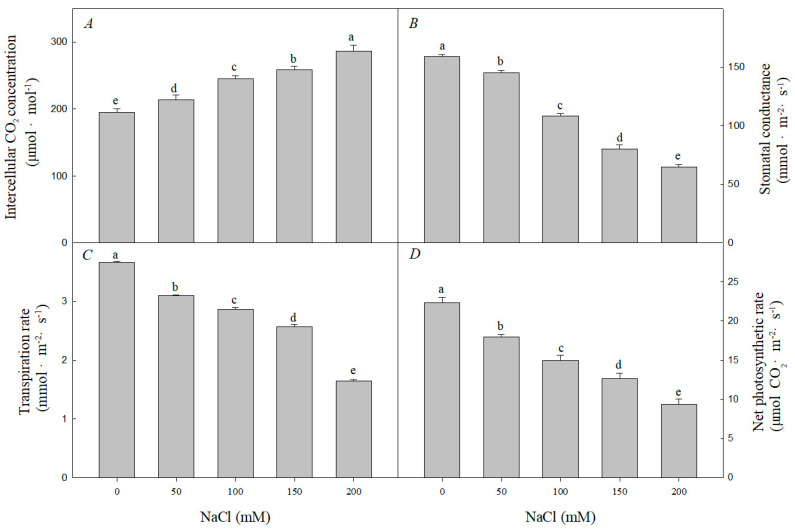
Figure 6.
Effect of NaCl stress on photosynthesis of R. pseudoacacia seedlings. (A) Intercellular CO2 concentration; (B) stomatal conductance; (C) transpiration rate; (D) net photosynthetic rate. Values are mean ± SD of five biological replicates. Bars with different letters are significantly different at p < 0.05 according to Duncan’s multiple range tests.

