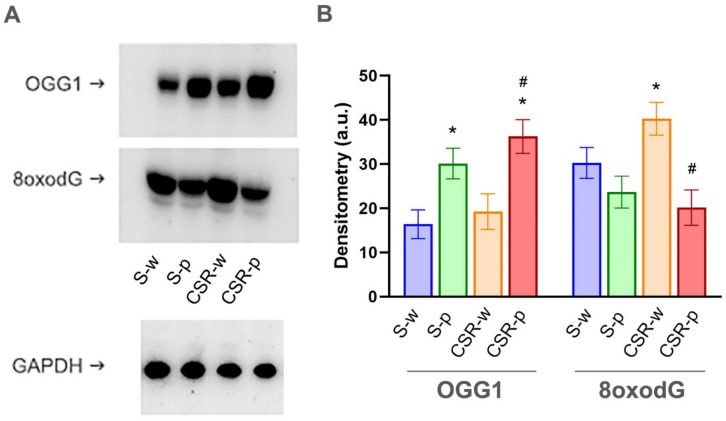
Figure 3.
Effects of CSR and SLAB51 on DNA oxidation. (A). Representative bands for OGG1 and 8-oxodG levels in brain homogenates of all groups. Equal protein loading was verified by using an anti-GAPDH antibody. (B). Quantification of OGG1 and 8-oxodG levels. The densitometric analyses obtained from three separate blots. Values are mean ± SEM. One-way ANOVA results were (F (3, 24) = 6.304; p = 0.00262) for OGG1, (F (3, 24) = 6.698; p = 0.00192) for 8oxodG. * indicates statistical significance relative to S-w, while # indicates statistical significance between CSR-w and CSR-p.

