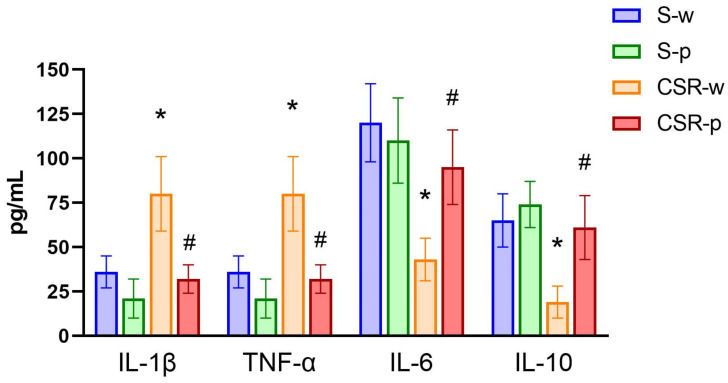
Figure 5.
Effects of CSR and SLAB51 on systemic inflammation. Proinflammatory and anti-inflammatory cytokines levels in blood plasma of all groups of mice. Analytes concentrations are expressed as mean ± SEM. One-way ANOVA results were (F (3, 24) = 3.379; p = 0.03473) for IL-6, (F (3, 24) = 7.816; p = 0.00082) for IL-10, (F (3, 24) = 6.376; p = 0.00248) for TNFα, and (F (3, 24) = 9.891; p = 0.0002) for IL-1β. * indicates statistical significance between S-w and CSR-w, while # indicates statistical significance between CSR-w and CSR-p.

