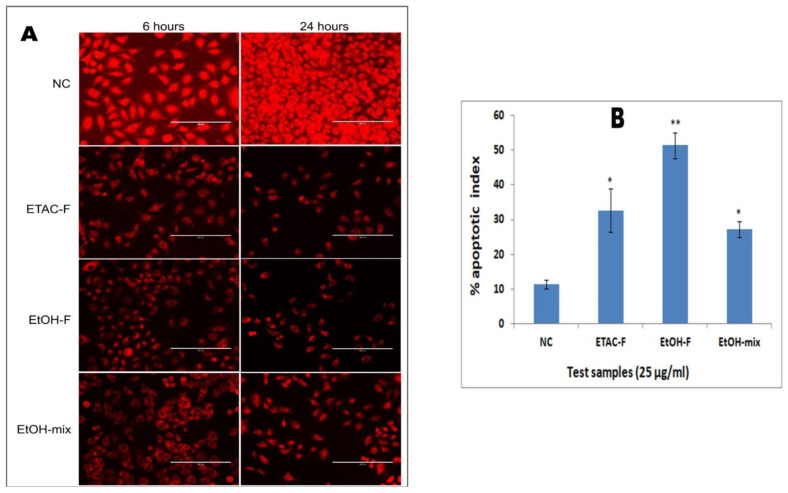
Figure 6.
(A) The photo-micrographs call attention to the capability of the extracts to interrupt the potential of the mitochondrial membrane. (B) Graphical illustration of percentage apoptotic indices. The apoptotic index for every test group was expressed as the percentage of the ratio of the unstained cell no./overall cell no. in 10 different fields. NC (7.2 ± 0.8%) = negative control; ETAC-F (49.4 ± 2.7%) = ethyl-acetate extract of flower; EtOH-F (56.2 ± 4.8%) = ethanol extract of flower; EtOH-mix (36.9 ± 3.6%) = ethanol extract of mixture. Values presented as percentage mean ± standard deviation (n = 6), ** represents p < 0.01 and * represents p < 0.05.

