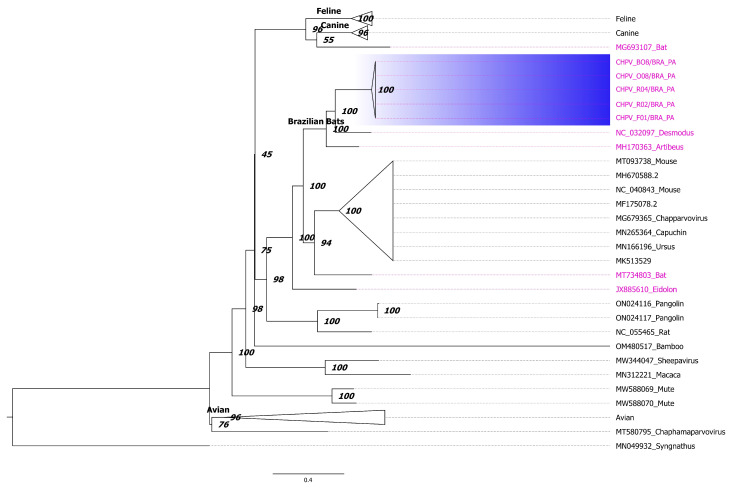
Figure 2.
Maximum likelihood tree of chaphamaparvoviruses. The tree was constructed using complete CHPV. Some clades composed by sequences isolated from the same host (i.e., Feline, Canine and Avian) were collapsed to facilitate the visualization. Sequences identified in bats are indicated by magenta color. The tree is unrooted and numbers in the nodes represent bootstrap values. Horizontal line under the tree indicates the number of nucleotide substitutions per site. The tree was constructed using GTR model plus gamma correction and the proportion of invariable sites was estimated. Bootstrap values were calculated using the ultra-fast approximation approach [57].

