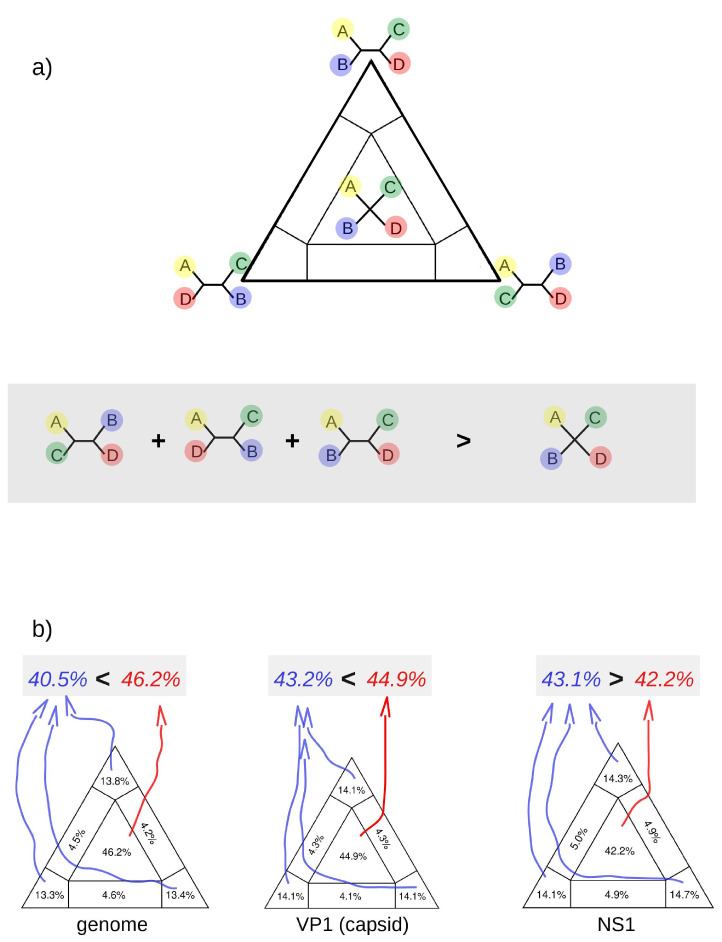
Figure 3.
Maximum likelihood map. (a) Schematic representation of the maximum likelihood map approach. In the triangular surface, individual likelihoods of all possible quartets will be plotted. The likelihoods of resolved quartets occupy vertices of the triangle and the likelihoods of unresolved trees will occupy the center of the surface. Alignments with proper phylogenetic signals generate likelihood maps in which the proportion of plotted likelihoods in the center of the triangle is lower than the sum of likelihoods in all vertices (diagram in the gray area). (b) Likelihood maps of the genome, VP1 and NS1 regions of parvoviruses.

