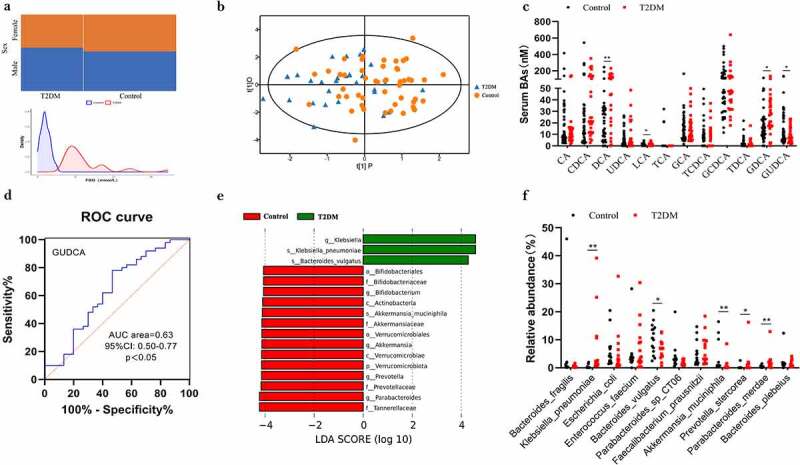
Figure 1.

Profile of the bile acids and gut microbiota in individuals with T2DM. a Sex proportions and FBG distribution in T2DM and Control. b OPLS-DA plot of bile acids levels in T2DM (blue) and Control (orange). c Determination of serum bile acids in T2DM and Control group. P values were analyzed by two-tailed Mann–Whitney U-test and data were presented as medians. d ROC of GUDCA in predicting T2DM. AUC: area under curve. e Analysis with the linear discriminant analysis (LDA). Green indicates enriched taxa in the T2DM group. Red indicates enriched taxa in the Control group. f Different species abundance of T2DM and Control based on metagenomics data. n=15 individuals/groups. *p<0.05,**p<0.01.
