
Figure 4.
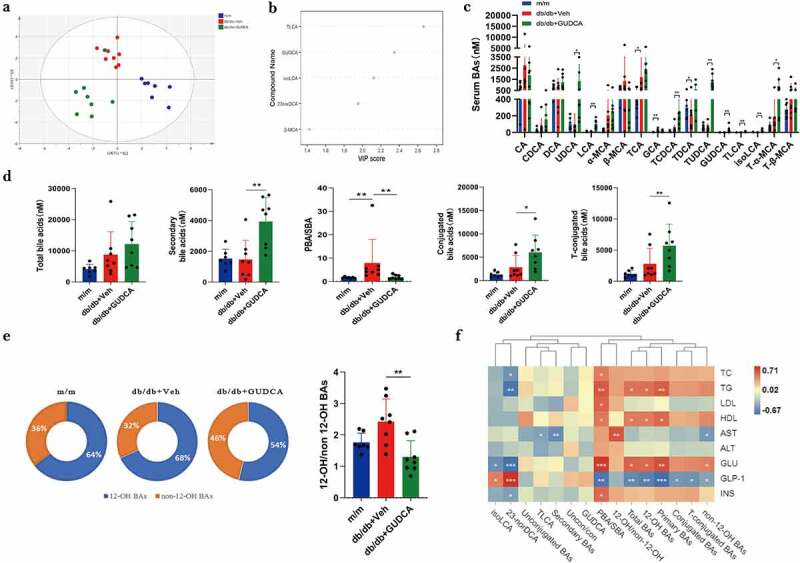
Dysregulated BA profiles in m/m, db/db+veh and db/db+gudca. a Orthogonal partial least squared-discriminant analysis (OPLS-DA) scores plot of serum BA profiles showing the group of m/m (blue) group, db/db+veh (red) and db/db+gudca (green). b the variable importance in projection (VIP) scores from OPLS-DA model based on the serum BA profiles between the db/db+veh and db/db+gudca group. c, d, e Profiles of BAs in the db/db+veh group. *p< 0.05, **p< 0.01. All data are presented as the mean ± sd. f Heatmap of spearman correlation association between serum BAs and blood indicators from three groups. *p< 0.05.