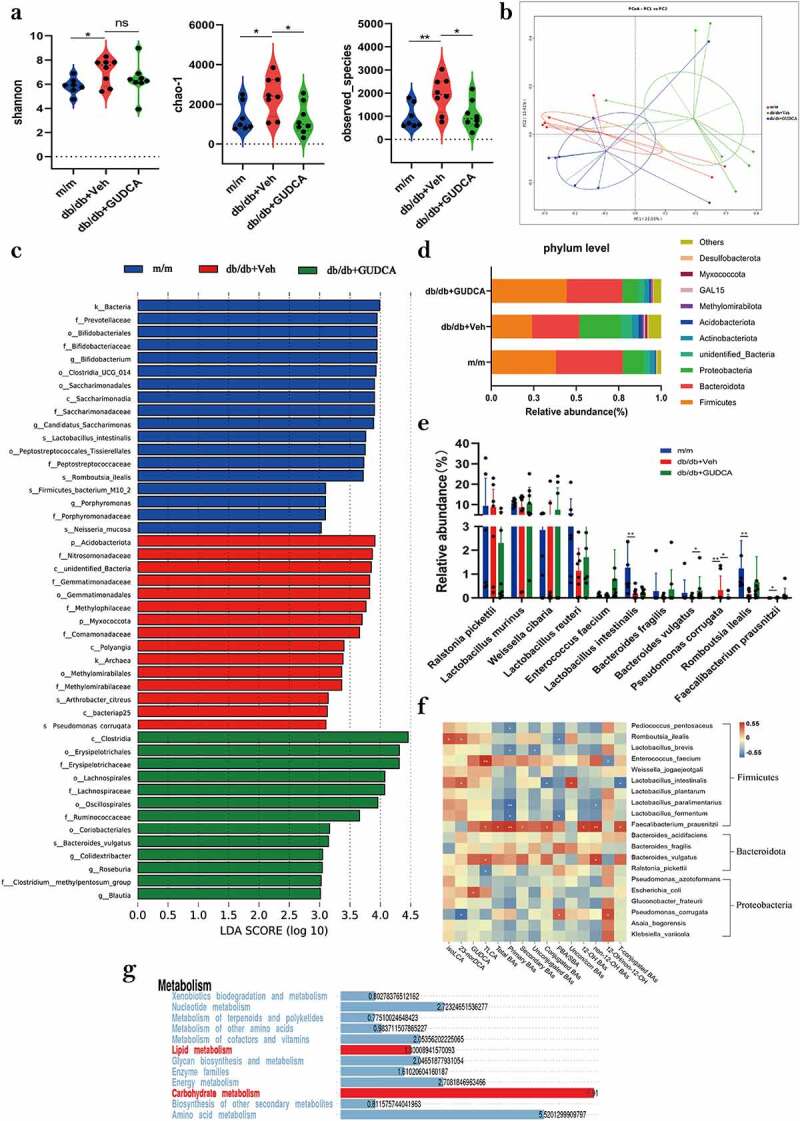
Figure 5.

GUDCA modulates the composition of gut commensal bacteria. a α-diversity of the gut microbiota, as indicated by the Shannon, Chao1 indices and observed species. b Principle coordinate analysis (PCOA) plot generated using OTU metrics based on the Binary-Jaccard similarity for m/m, db/db+veh and db/db+gudca groups. c Taxonomic cladogram generated from LEfSe of metagenomic sequencing data. Blue indicates enriched taxa in the m/m group. Red indicates enriched taxa in the db/db+veh group. Green indicates enriched taxa in the db/db+gudca group. d the relative abundance of phylum level in the db/db+veh group. e Dysregulated gut microbiota in the db/db+veh group. *p< 0.05, **p< 0.01. P values were determined by two-tailed Mann–Whitney U-test and data are presented as the mean ± sd. f Heatmap of spearman correlation coefficients between serum BAs and blood biochemical parameters from all samples in the three groups. *p< 0.05(spearman’s correlation with the post hoc correction using the Holm method). g Kyoto Encyclopedia of Genes and Genomes annotation of key altered metabolic pathways in three groups.
