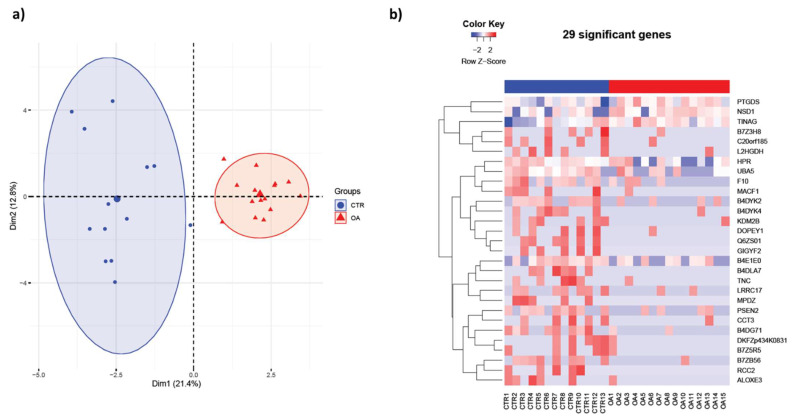
Figure 1.
Synovial fluid protein content differs in female osteoarthritis (OA) patients. (a) Principal component analysis (PCA) mapping of female OA and non-OA (control) profiling. Female OA group (indicated by red triangles) was clustered distinctly from non-OA (control) group (indicated by blue circles). (b) Heatmap of (a) female OA (n = 15) and non-OA (n = 13) patients. Differences between normal and OA patients were examined using the empirical Bayes moderated test, and only those that were significantly different at the p value 0.05 level were selected.

