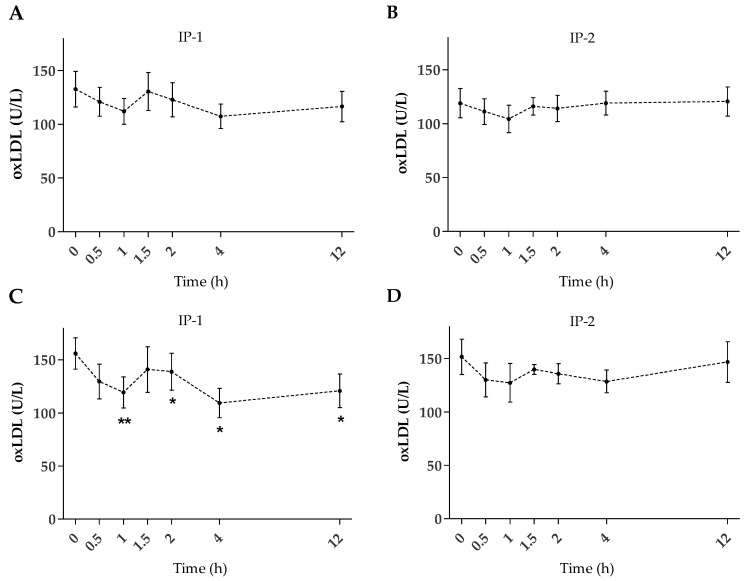
Figure 2.
Mean plasma oxLDL concentration over time before (0 h) and after dietary interventions. (A) IP-1 (n = 12), (B) IP-2 (n = 13), and using the highest oxLDL concentration at baseline (C) IP-1 (n = 9), and (D) IP-2 (n = 7). Bars: SEM. Significantly different from baseline with *: p < 0.05, and **: p < 0.01.

