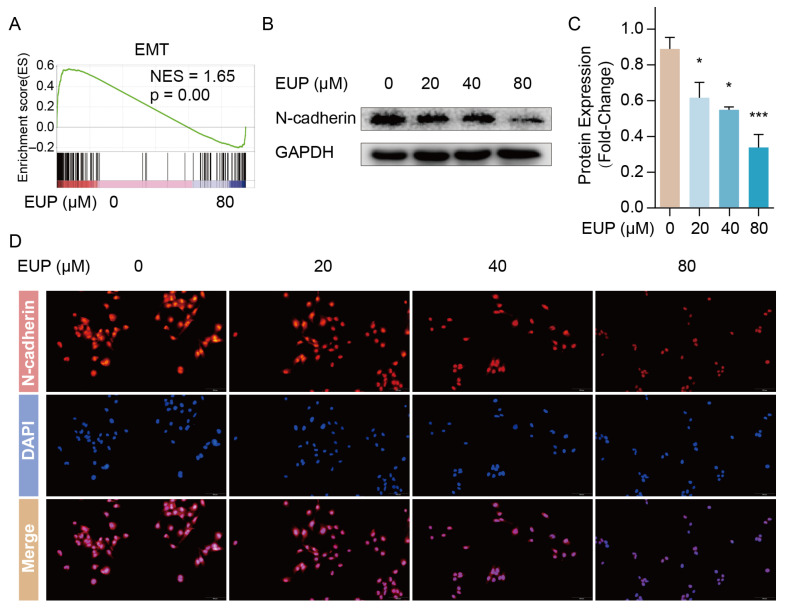
Figure 3.
Eupatilin down-regulated genes of EMT process in LX-2 cells. (A) Enrichment plot of EMT gene set. (B) The expression of N-cadherin protein detected 48 h after eupatilin treatment by Western blotting. (C) Relative protein signal intensity was quantified as mean ± standard deviation (mean ± SD, n = 3). p values are calculated by one-way ANOVA followed by the Tukey’s test. * p < 0.05 and *** p < 0.001 vs. 0 μM EUP group. (D) Immunofluorescence staining for N-cadherin (red) in LX-2 cells. Nuclei were counter-stained with DAPI (blue). EUP: Eupatilin; EMT: Epithelial–mesenchymal transition; GAPDH: Glyceraldehyde-3-phosphate dehydrogenase; DAPI: 4′,6-diamidino-2-phenylindole.

