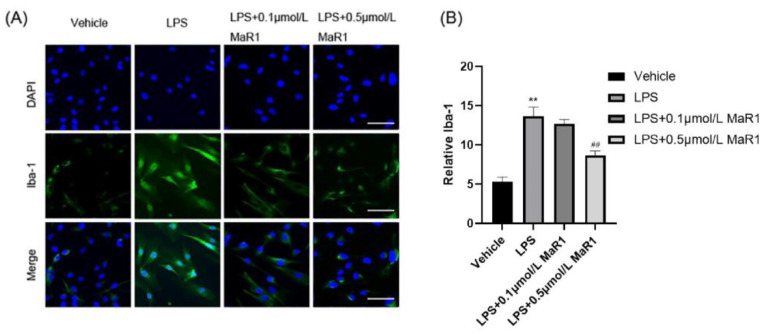
Figure 6.
MaR1 treatment (0.5 μmol/L) inhibited LPS-induced microglia activation and morphological changes in BV2 cells: (A) LPS-induced fluorescent Iba-1 (green)/DAPI (blue) immunostaining, bar = 50 μm; (B) quantification of the Iba-1 immunofluorescence; all data are expressed as mean ± SD; ** p < 0.01, compared to the Vehicle group; ## p < 0.01, compared to the LPS group.

