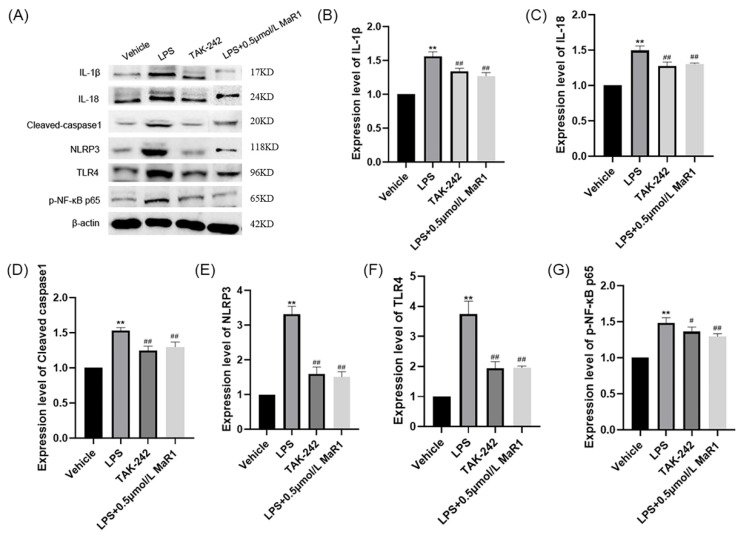
Figure 7.
Levels of IL-1β, IL-18, cleaved-caspase1, TLR4, NLRP3, and pNF-κB p65 were determined by Western blot. (A) western blot images; (B–G)The β-actin was used as an internal reference, statistical bar graph of protein expression levels; ** p < 0.01, compared to the Vehicle group; # p < 0.05, ## p < 0.01, compared to the LPS group.

